

Answered step by step
Verified Expert Solution
Question
1 Approved Answer
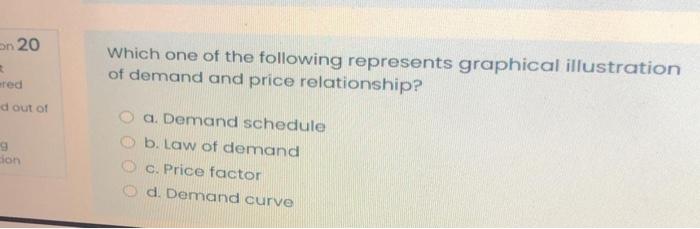
on 20 Which one of the following represents graphical illustration of demand and price relationship? red d out of 9 son a. Demand schedule b.
Step by Step Solution
There are 3 Steps involved in it
Step: 1

Get Instant Access to Expert-Tailored Solutions
See step-by-step solutions with expert insights and AI powered tools for academic success
Step: 2

Step: 3
Ace Your Homework with AI
Get the answers you need in no time with our AI-driven, step-by-step assistance
Get Started
Glencoe Accounting Real World Applications And Connections Advanced Course Audit Tests
Authors: McGraw-Hill
5th Edition
0078462002, 978-0078462009