

Answered step by step
Verified Expert Solution
Question
1 Approved Answer
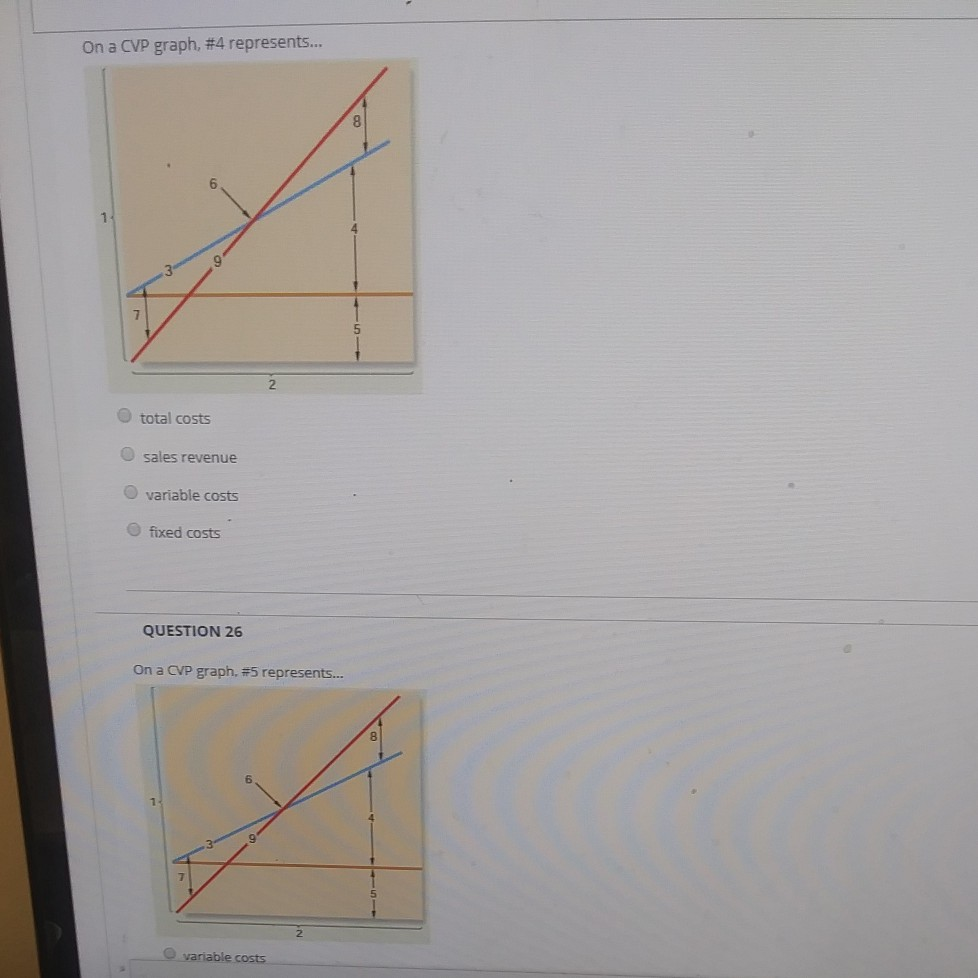
On a CVP graph, #4 represents... 8 total costs sales revenue variable costs fixed costs QUESTION 26 On a CVP graph. #5 represents... variable costs
On a CVP graph, #4 represents... 8 total costs sales revenue variable costs fixed costs QUESTION 26 On a CVP graph. #5 represents... variable costs
Step by Step Solution
There are 3 Steps involved in it
Step: 1

Get Instant Access to Expert-Tailored Solutions
See step-by-step solutions with expert insights and AI powered tools for academic success
Step: 2

Step: 3
Ace Your Homework with AI
Get the answers you need in no time with our AI-driven, step-by-step assistance
Get Started
Financial Analysis
Authors: Paul Rodgers
4th Edition
075068674X, 978-0750686747