On a FIFO basis, what are the percent changes in the cost per completed unit from one group to the next over the three-month period? What may have caused these differences?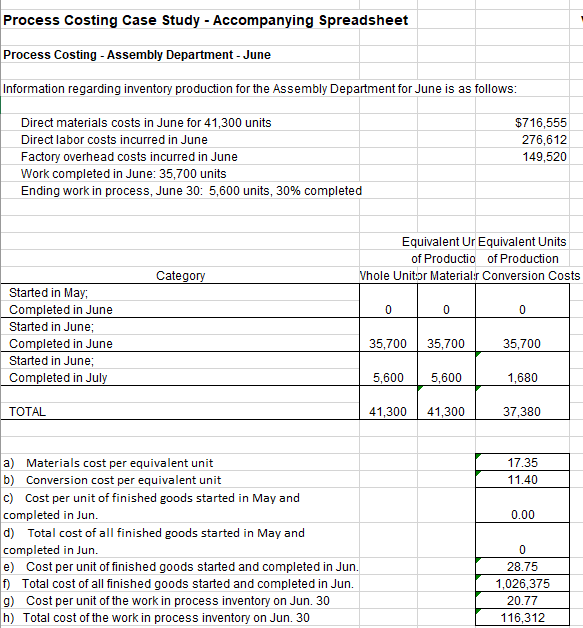
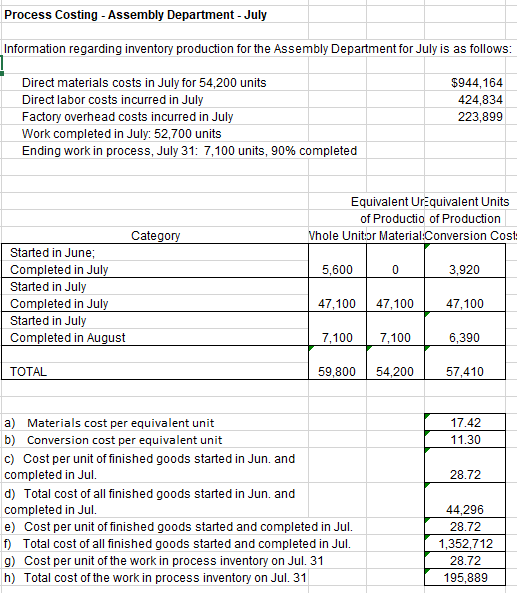
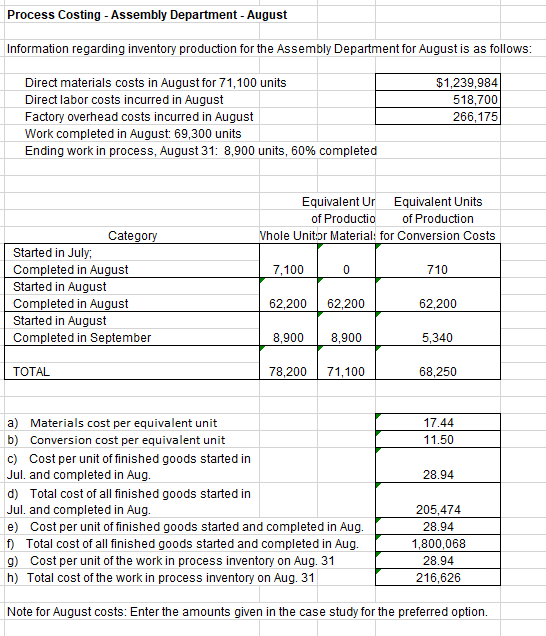
Process Costing Case Study - Accompanying Spreadsheet Process Costing - Assembly Department - June Information regarding inventory production for the Assembly Department for June is as follows: Direct materials costs in June for 41,300 units Direct labor costs incurred in June Factory overhead costs incurred in June Work completed in June: 35,700 units Ending work in process, June 30: 5,600 units, 30% completed $716,555 276,612 149,520 Equivalent Ur Equivalent Units of Productio of Production Vhole Unitor Material: Conversion Costs Category 0 0 0 Started in May; Completed in June Started in June; Completed in June Started in June; Completed in July 35,700 35,700 35,700 5,600 5,600 1,680 TOTAL 41,300 41,300 37,380 17.35 11.40 0.00 a) Materials cost per equivalent unit b) Conversion cost per equivalent unit c) Cost per unit of finished goods started in May and completed in Jun. d) Total cost of all finished goods started in May and completed in Jun. e) Cost per unit of finished goods started and completed in Jun. f) Total cost of all finished goods started and completed in Jun. 9) Cost per unit of the work in process inventory on Jun. 30 h) Total cost of the work in process inventory on Jun. 30 0 28.75 1,026,375 20.77 116,312 Process Costing - Assembly Department - July Information regarding inventory production for the Assembly Department for July is as follows: Direct materials costs in July for 54,200 units Direct labor costs incurred in July Factory overhead costs incurred in July Work completed in July: 52,700 units Ending work in process, July 31: 7,100 units, 90% completed $944,164 424,834 223,899 Equivalent Urequivalent Units of Productio of Production Vhole Unitor Material:Conversion Cost 5,600 0 3,920 Category Started in June; Completed in July Started in July Completed in July Started in July Completed in August 47,100 47,100 47,100 7,100 7,100 6,390 TOTAL 59,800 54,200 57,410 17.42 11.30 28.72 a) Materials cost per equivalent unit b) Conversion cost per equivalent unit c) Cost per unit of finished goods started in Jun. and completed in Jul. d) Total cost of all finished goods started in Jun. and completed in Jul. e) Cost per unit of finished goods started and completed in Jul. f) Total cost of all finished goods started and completed in Jul. g) Cost per unit of the work in process inventory on Jul. 31 h) Total cost of the work in process inventory on Jul. 31 44,296 28.72 1,352,712 28.72 195,889 Process Costing - Assembly Department - August Information regarding inventory production for the Assembly Department for August is as follows: Direct materials costs in August for 71,100 units Direct labor costs incurred in August Factory overhead costs incurred in August Work completed in August: 69,300 units Ending work in process, August 31: 8,900 units, 60% completed $1,239,984 518,700 266,175 Equivalent Ur Equivalent Units of Productio of Production Vhole Unitor Material: for Conversion Costs 7,100 710 Category Started in July Completed in August Started in August Completed in August Started in August Completed in September 62,200 62,200 62,200 8,900 8,900 5,340 TOTAL 78,200 71,100 68,250 17.44 11.50 28.94 a) Materials cost per equivalent unit b) Conversion cost per equivalent unit c) Cost per unit of finished goods started in Jul. and completed in Aug. d) Total cost of all finished goods started in Jul. and completed in Aug. e) Cost per unit of finished goods started and completed in Aug. f) Total cost of all finished goods started and completed in Aug. g) Cost per unit of the work in process inventory on Aug. 31 h) Total cost of the work in process inventory on Aug. 31 205,474 28.94 1,800,068 28.94 216,626 Note for August costs: Enter the amounts given in the case study for the preferred option. Process Costing Case Study - Accompanying Spreadsheet Process Costing - Assembly Department - June Information regarding inventory production for the Assembly Department for June is as follows: Direct materials costs in June for 41,300 units Direct labor costs incurred in June Factory overhead costs incurred in June Work completed in June: 35,700 units Ending work in process, June 30: 5,600 units, 30% completed $716,555 276,612 149,520 Equivalent Ur Equivalent Units of Productio of Production Vhole Unitor Material: Conversion Costs Category 0 0 0 Started in May; Completed in June Started in June; Completed in June Started in June; Completed in July 35,700 35,700 35,700 5,600 5,600 1,680 TOTAL 41,300 41,300 37,380 17.35 11.40 0.00 a) Materials cost per equivalent unit b) Conversion cost per equivalent unit c) Cost per unit of finished goods started in May and completed in Jun. d) Total cost of all finished goods started in May and completed in Jun. e) Cost per unit of finished goods started and completed in Jun. f) Total cost of all finished goods started and completed in Jun. 9) Cost per unit of the work in process inventory on Jun. 30 h) Total cost of the work in process inventory on Jun. 30 0 28.75 1,026,375 20.77 116,312 Process Costing - Assembly Department - July Information regarding inventory production for the Assembly Department for July is as follows: Direct materials costs in July for 54,200 units Direct labor costs incurred in July Factory overhead costs incurred in July Work completed in July: 52,700 units Ending work in process, July 31: 7,100 units, 90% completed $944,164 424,834 223,899 Equivalent Urequivalent Units of Productio of Production Vhole Unitor Material:Conversion Cost 5,600 0 3,920 Category Started in June; Completed in July Started in July Completed in July Started in July Completed in August 47,100 47,100 47,100 7,100 7,100 6,390 TOTAL 59,800 54,200 57,410 17.42 11.30 28.72 a) Materials cost per equivalent unit b) Conversion cost per equivalent unit c) Cost per unit of finished goods started in Jun. and completed in Jul. d) Total cost of all finished goods started in Jun. and completed in Jul. e) Cost per unit of finished goods started and completed in Jul. f) Total cost of all finished goods started and completed in Jul. g) Cost per unit of the work in process inventory on Jul. 31 h) Total cost of the work in process inventory on Jul. 31 44,296 28.72 1,352,712 28.72 195,889 Process Costing - Assembly Department - August Information regarding inventory production for the Assembly Department for August is as follows: Direct materials costs in August for 71,100 units Direct labor costs incurred in August Factory overhead costs incurred in August Work completed in August: 69,300 units Ending work in process, August 31: 8,900 units, 60% completed $1,239,984 518,700 266,175 Equivalent Ur Equivalent Units of Productio of Production Vhole Unitor Material: for Conversion Costs 7,100 710 Category Started in July Completed in August Started in August Completed in August Started in August Completed in September 62,200 62,200 62,200 8,900 8,900 5,340 TOTAL 78,200 71,100 68,250 17.44 11.50 28.94 a) Materials cost per equivalent unit b) Conversion cost per equivalent unit c) Cost per unit of finished goods started in Jul. and completed in Aug. d) Total cost of all finished goods started in Jul. and completed in Aug. e) Cost per unit of finished goods started and completed in Aug. f) Total cost of all finished goods started and completed in Aug. g) Cost per unit of the work in process inventory on Aug. 31 h) Total cost of the work in process inventory on Aug. 31 205,474 28.94 1,800,068 28.94 216,626 Note for August costs: Enter the amounts given in the case study for the preferred option