

Answered step by step
Verified Expert Solution
Question
1 Approved Answer
On a stand-alone basis which corporation is the least risky? Construct a scatter diagram graph that shows Goodmans and Landry returns on the vertical axis
- On a stand-alone basis which corporation is the least risky?
- Construct a scatter diagram graph that shows Goodmans and Landry returns on the vertical axis and the Market Indexs returns on the horizontal axis.
- Estimate Goodmans and Landrys betas as the slopes of regression lines with stock returns on the vertical axis (y-axis) and market return on the horizontal axis (x-axis). (Hint: use Excels SLOPE function.) Are these betas consistent with your graph?
- The risk-free rate on long-term Treasury bonds is 8.04%. Assume that the market risk premium is 6%. What is the expected return on the market? Now use the SML equation to calculate the two companies' required returns.
- If you formed a portfolio that consisted of 60% Goodman stock and 40% Landry stock, what would be its beta and its required return?
- Suppose an investor wants to include Goodman Industries stock in his or her portfolio. Stocks A, B, and C are currently in the portfolio, and their betas are 0.769, 0.985, and 1.423, respectively. Calculate the new portfolios required return if it consists of 30% of Goodman, 20% of Stock A, 30% of Stock B, and 20% of Stock C.
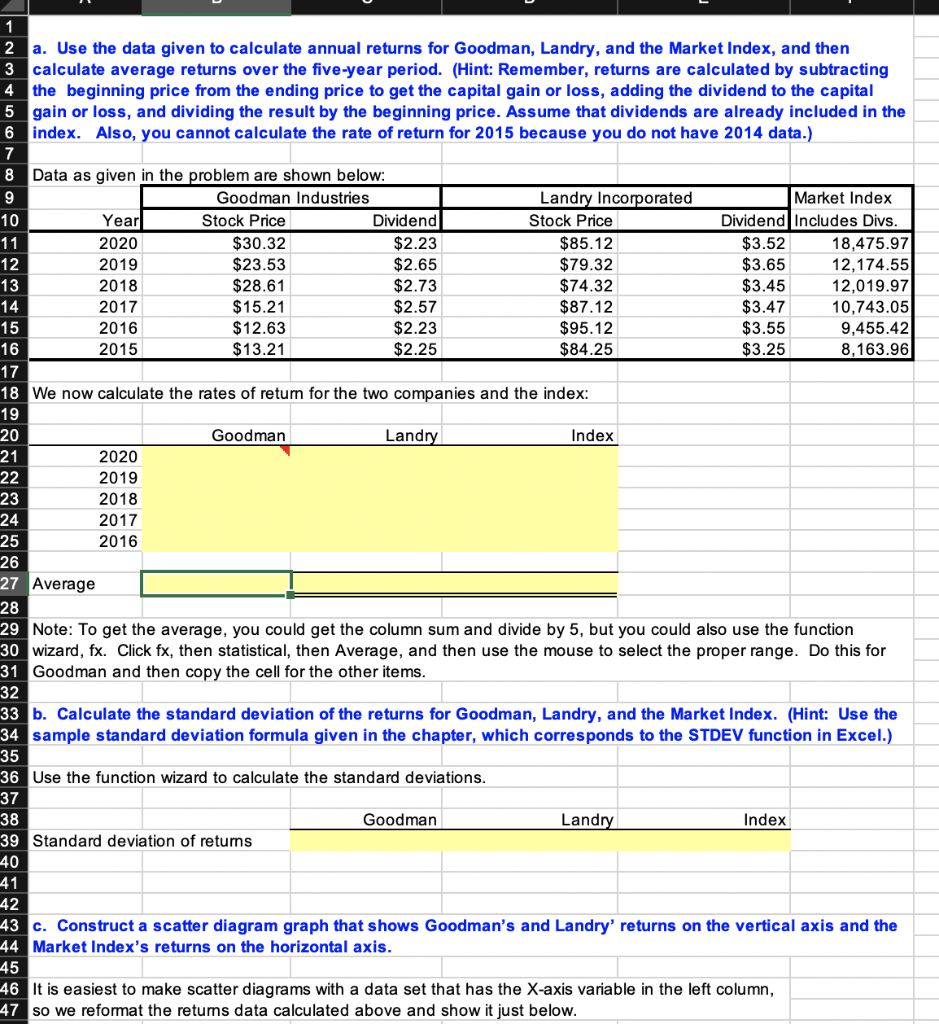
1 2 a. Use the data given to calculate annual returns for Goodman, Landry, and the Market Index, and then 3 calculate average returns over the five-year period. (Hint: Remember, returns are calculated by subtracting 4 the beginning price from the ending price to get the capital gain or loss, adding the dividend to the capital 5 gain or loss, and dividing the result by the beginning price. Assume that dividends are already included in the 6 index. Also, you cannot calculate the rate of return for 2015 because you do not have 2014 data.) 7 8 Data as given in the problem are shown below: 9 Goodman Industries Landry Incorporated Market Index 10 Year Stock Price Dividend Stock Price Dividend Includes Divs. 11 2020 $30.32 $2.23 $85.12 $3.52 18,475.97 12 2019 $23.53 $2.65 $79.32 $3.65 12,174.55 13 2018 $28.61 $2.73 $74.32 $3.45 12,019.97 14 2017 $15.21 $2.57 $87.12 $3.47 10,743.05 15 2016 $12.63 $2.23 $95.12 $3.55 9,455.42 16 2015 $13.21 $2.25 $84.25 $3.25 8,163.96 17 18 We now calculate the rates of return for the two companies and the index: 19 20 Goodman Landry Index 21 2020 22 2019 23 2018 24 2017 25 2016 26 27 Average 28 29 Note: To get the average, you could get the column sum and divide by 5, but you could also use the function 30 wizard, fx. Click fx, then statistical, then Average, and then use the mouse to select the proper range. Do this for 31 Goodman and then copy the cell for the other items. 32 33 b. Calculate the standard deviation of the returns for Goodman, Landry, and the Market Index. (Hint: Use the 34 sample standard deviation formula given in the chapter, which corresponds to the STDEV function in Excel.) 35 36 Use the function wizard to calculate the standard deviations. 37 38 Goodman Landry Index 39 Standard deviation of returns 40 41 42 43 c. Construct a scatter diagram graph that shows Goodman's and Landry' returns on the vertical axis and the 44 Market Index's returns on the horizontal axis. 45 46 It is easiest to make scatter diagrams with a data set that has the X-axis variable in the left column, 47 so we reformat the retums data calculated above and show it just below
Step by Step Solution
There are 3 Steps involved in it
Step: 1

Get Instant Access to Expert-Tailored Solutions
See step-by-step solutions with expert insights and AI powered tools for academic success
Step: 2

Step: 3
Ace Your Homework with AI
Get the answers you need in no time with our AI-driven, step-by-step assistance
Get Started
Finance For Small And Entrepreneurial Business
Authors: Richard Roberts
1st Edition
0415721008, 978-0415721004