Question
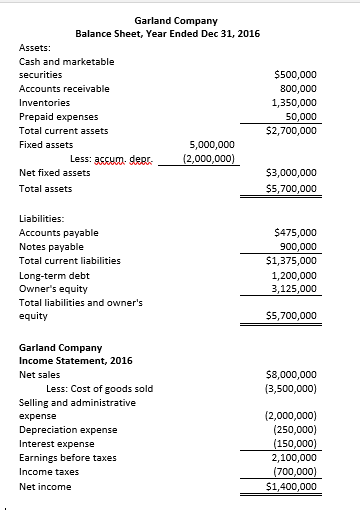
On account of its very recent entry into a lucrative market, Garland Company (whose financials are given above) projects an 18% increase in sales for

On account of its very recent entry into a lucrative market, Garland Company (whose financials are given above) projects an 18% increase in sales for next year (2017). NOTE: All numbers in the financials are in thousands of dollars. The company paid out $1.26 billion in dividends in 2016, and its payout ratio is constant. Current assets and net fixed assets, and all operating expenses, vary directly with sales. Accounts payables will also maintain their existing relationship to sales; the other liabilities, however, are not spontaneous. Management has decided that any required additional funding will be raised through long-term debt, on which it pays an interest rate of 8.5%. Any short-term debt will be rolled over at the same interest rate as existed at the end of 2016. Long-term debt will increase by the full amount of any estimated EFN (i.e., no principal pay-down on existing debt is anticipated for next year, 2017). The tax rate for 2016 will apply for 2017 as well.
Estimate the external financing needed (EFN) for 2017, based on the projected growth in sales, using the percentage of sales method. Make sure to set up an assumptions box, and automate the iterations needed to estimate EFN. Please do NOT perform iterations manually by setting up numerous pro forma Income Statements and Liabilities & Equity columns!
Garland Company Balance Sheet, Year Ended Dec 31, 2016 Assets: Cash and marketable $500,000 800,000 1,350,000 50,000 $2,700,000 Accounts receivable Prepaid expenses Total current assets Fixed assets 5,000,000 3C5uuD geR (2,000,000) $3,000,000 $5,700,000 Net fixed assets Total assets Liabilities: Accounts payable Notes Total current liabilities Long-term debt Owner's equity Total liabilities and owner's equity $475,000 900,000 51,375,000 1,200,000 3,125,000 payable $5,700,000 Garland Company Income Statement, 2016 Net sales $8,000,000 (3,500,000) Less: Cost of goods sold Selling and administrative expense Depreciation expense Interest expense Earnings before taxes Income taxes Net income (2,000,000) (250,000) 150,000) 2,100,000 (700,000) 51,400,000 Garland Company Balance Sheet, Year Ended Dec 31, 2016 Assets: Cash and marketable $500,000 800,000 1,350,000 50,000 $2,700,000 Accounts receivable Prepaid expenses Total current assets Fixed assets 5,000,000 3C5uuD geR (2,000,000) $3,000,000 $5,700,000 Net fixed assets Total assets Liabilities: Accounts payable Notes Total current liabilities Long-term debt Owner's equity Total liabilities and owner's equity $475,000 900,000 51,375,000 1,200,000 3,125,000 payable $5,700,000 Garland Company Income Statement, 2016 Net sales $8,000,000 (3,500,000) Less: Cost of goods sold Selling and administrative expense Depreciation expense Interest expense Earnings before taxes Income taxes Net income (2,000,000) (250,000) 150,000) 2,100,000 (700,000) 51,400,000Step by Step Solution
There are 3 Steps involved in it
Step: 1

Get Instant Access to Expert-Tailored Solutions
See step-by-step solutions with expert insights and AI powered tools for academic success
Step: 2

Step: 3

Ace Your Homework with AI
Get the answers you need in no time with our AI-driven, step-by-step assistance
Get Started


