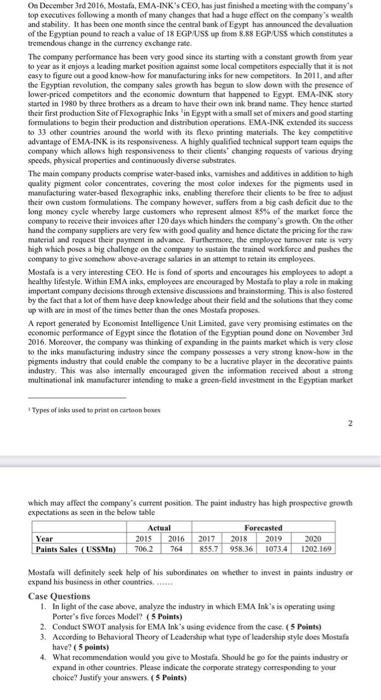
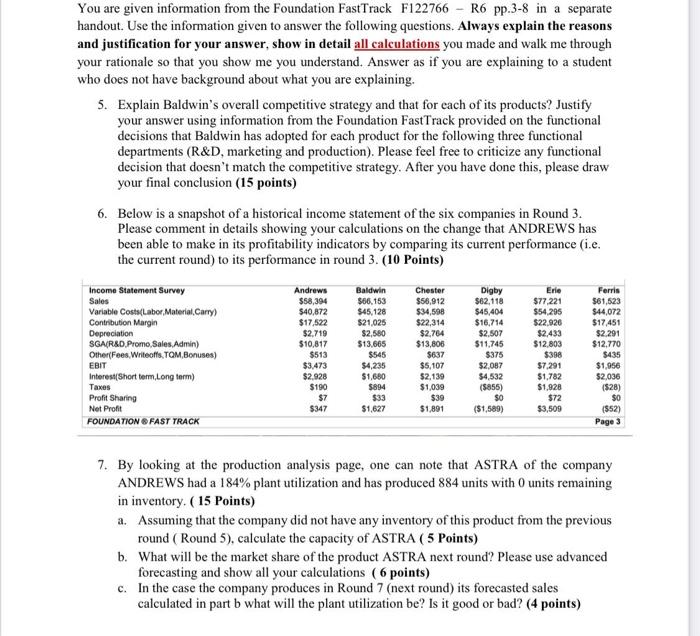
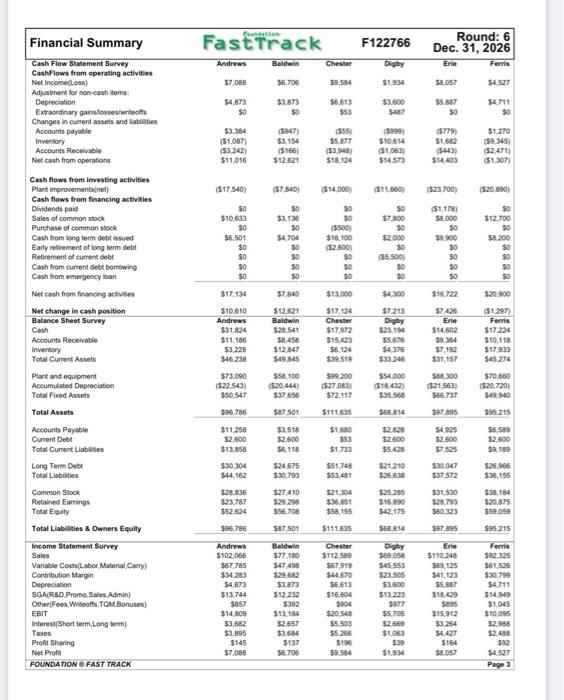
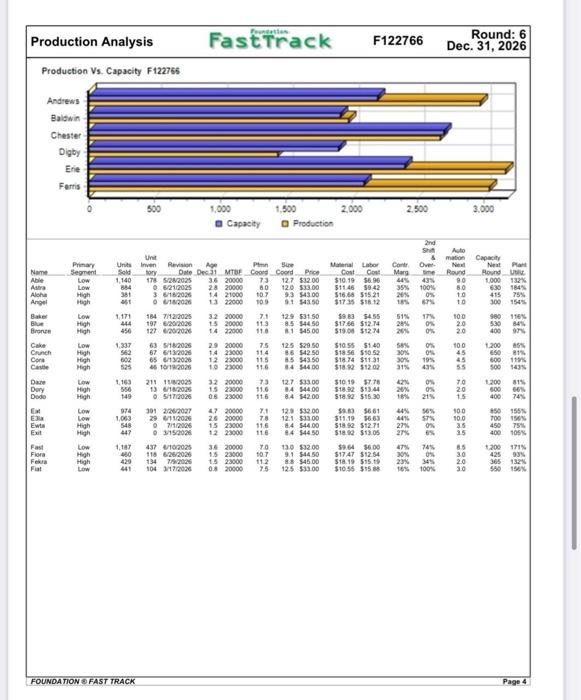
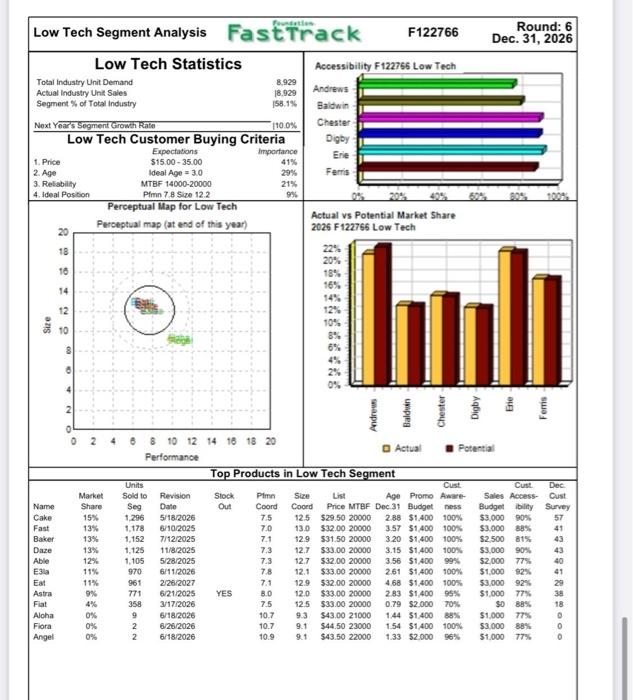
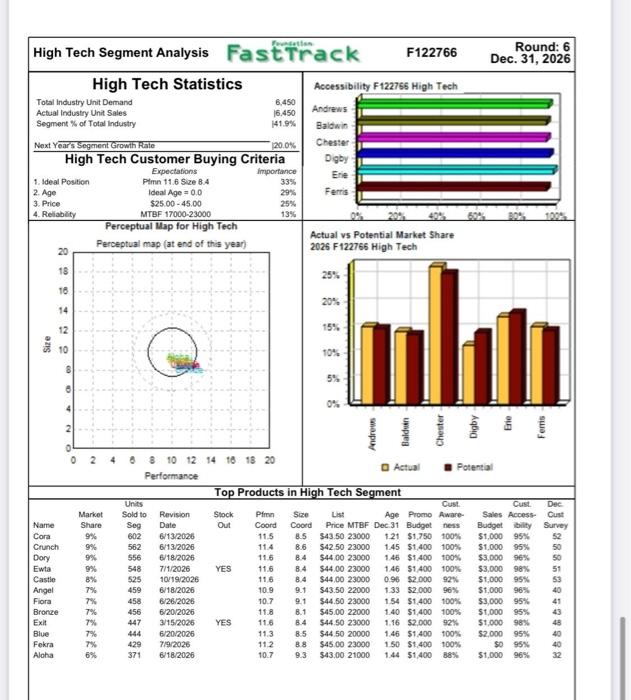
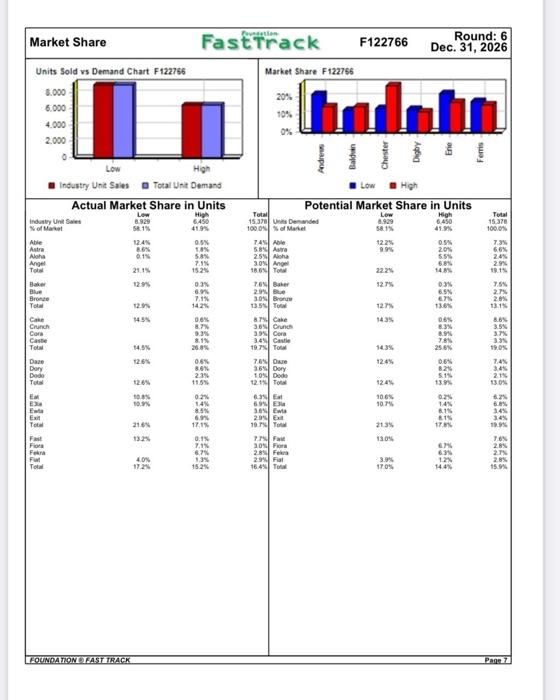
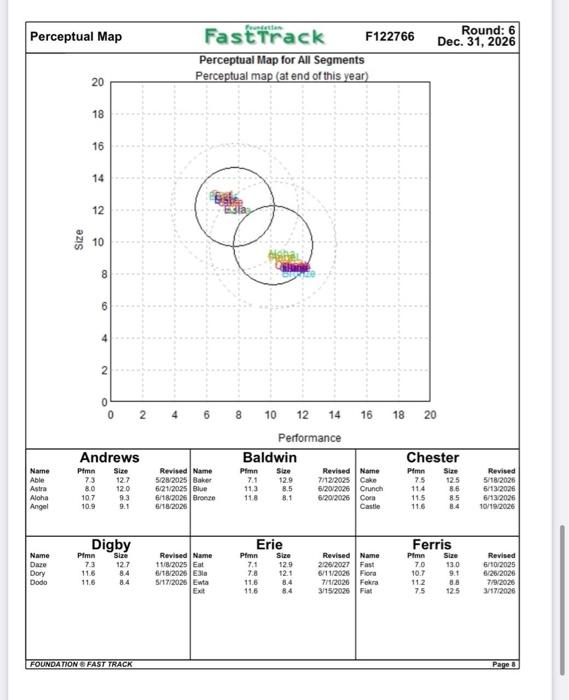
On December 3rd 2016, Mostafa, EMA-INK'S CEO, has just finished a meeting with the company's top executives following a month of many changes that had a huge effect on the company's wealth and stability. It has been one month since the central bank of Egypt has announced the devaluation of the Egyptian pound to reach a value of 18 EGP USS up from 8.88 EGP USS which constitutes a tremendous change in the currency exchange rate The company performance has been very good since its starting with a constant growth from year to year as it enjoys a leading market position against some local competitors especially that it is not easy to figure out a good know-how for manufacturing inks for new competitors. In 2011, and after the Egyptian revolution, the company sales prowth has begun to slow down with the presence of lower-priced competitors and the economic downturn that happened to Egypt. EMA-INK story started in 1980 by three brothers as a dream to have their own ink brand name. They hence started their first production Site of Flexographic Inks'in Egypt with a small set of mixers and good starting formulations to begin their production and distribution operations EMA-INK extended its success 60 33 other countries around the world with its flexo printing materials. The key competitive advantage of EMA-INK is its responsiveness. A highly qualified technical support team equips the company which allows high responsiveness to their clients changing requests of various drying speeds, physical properties and continuously diverse substrates The main company products comprise water-based inks, varnishes and additives in addition to high quality pigment color concentrates, covering the mod color indexes for the pigments used in manufacturing water-based flexographic inks, enabling therefore their clients to be free to adjust their own custom formulations. The company however, suffers from a big cash deficit due to the long money cycle whereby large customers who represent almost 85% of the market force the company to receive their invoices after 120 days which hinder the company's growth. On the other hand the company suppliers are very few with good quality and hence dictate the pricing for the raw material and request their payment in advance. Furthermore, the employee turnover rate is very high which poses a big challenge on the company to sustain the trained workforce and pushes the company to give somehow above-average salaries in an attempt to retain its employees Mostafa is a very interesting CEO. He is fond of sports and encourages his employees to adopt a healthy lifestyle. Within EMA inks, employees are encouraged by Mostafa to play a role in making important company decisions through extensive discussions and brainstorming. This is also fostered by the fact that a lot of them have deep knowledge about their field and the solutions that they come up with are in most of the times better than the ones Mostafa proposes A report generated by Economist Intelligence Unit Limited, gave very promising estimates on the economic performance of Egypt since the flotation of the Egyptian pound done on November 3rd 2016. Moreover, the company was thinking of expanding in the parts market which is very close to the inks manufacturing industry since the company possesses a very strong know-how in the pigments industry that could enable the company to be a lucrative player in the decorative paints industry. This was also internally encouraged given the information received about a strong multinational ink manufacturer intending to make a groen-field investment in the Egyptian market Types of inks used to print on cartoons which may affect the company's current position. The paint industry has high prospective growth expectations as seen in the below table Actual Forecasted Year 2015 2016 2017 2018 2019 2020 Paints Sales (USSMA) 7062 8557 958,36 1073.4 1202.169 Mostafa will definitely seek help of his subordinates on whether to invest in paints industry or expand his business in other countries... Case Questions 1. In light of the case above, analyze the industry in which EMA Ink's is operating using Porter's five forces Model? (S Points) 2. Conduct SWOT analysis for EMA Ink's using evidence from the case. (5 Points) 3. According to Behavioral Theory of Leadership what type of leadership style does Mostafa have? (5 points) 4. What recommendation would you give to Mostafa. Should be go for the paints industry or expand in other countries. Please indicate the corporate strategy Corresponding to your choice Justify your answers (5 Points) You are given information from the Foundation FastTrack F122766 - R6 pp.3-8 in a separate handout. Use the information given to answer the following questions. Always explain the reasons and justification for your answer, show in detail all calculations you made and walk me through your rationale so that you show me you understand. Answer as if you are explaining to a student who does not have background about what you are explaining. 5. Explain Baldwin's overall competitive strategy and that for each of its products? Justify your answer using information from the Foundation FastTrack provided on the functional decisions that Baldwin has adopted for each product for the following three functional departments (R&D, marketing and production). Please feel free to criticize any functional decision that doesn't match the competitive strategy. After you have done this, please draw your final conclusion (15 points) 6. Below is a snapshot of a historical income statement of the six companies in Round 3. Please comment in details showing your calculations on the change that ANDREWS has been able to make in its profitability indicators by comparing its current performance (i.e. the current round) to its performance in round 3. (10 Points) Baldwin 566,153 $45,128 $21,025 $2.500 Income Statement Survey Sales Variable Costs Labor Material.Cary) Contribution Margin Depreciation SGAR&D Promo, Sales, Admin) Other Fees Writeos, TOM,Bonuses) EBIT Interest(Short term Long torm) Taxes Profit Sharing Net Profit FOUNDATION FAST TRACK Andrews $58,394 $40,872 $17,522 $2.719 $10,817 $513 $3,473 $2,928 $190 $7 $347 $13,665 $545 $4,235 $1,680 $894 Chester $56,912 $34,598 $22,314 $2.764 $13,806 $637 $5,107 $2,139 $1,039 $39 $1,891 Digby $62,118 $45,404 $16,714 $2.507 $11,745 $375 $2,087 $4,532 (5855) 50 ($1,589) Erle $77.221 $54,295 $22.920 $2,433 $12.803 $398 $7,291 $1,782 $1,928 $72 $3,509 Ferris $61,523 $44,072 $17,451 $2,291 $12.770 $435 $1,956 $2.036 (528) $0 (552) Page 3 $33 $1,627 7. By looking at the production analysis page, one can note that ASTRA of the company ANDREWS had a 184% plant utilization and has produced 884 units with O units remaining in inventory. (15 Points) a. Assuming that the company did not have any inventory of this product from the previous round ( Round 5), calculate the capacity of ASTRA ( 5 Points) b. What will be the market share of the product ASTRA next round? Please use advanced forecasting and show all your calculations (6 points) c. In the case the company produces in Round 7 (next round) its forecasted sales calculated in part b what will the plant utilization be? Is it good or bad? (4 points) Fast Track F122766 Round: 6 Dec. 31, 2026 Andrews Baldwin Chester Digby Erie Ferris $7.088 $6.705 59.584 58.057 54527 $1934 53.600 $4,873 50 55.873 56,613 353 $5.387 50 54.711 50 $3.354 $1.087 ($3,242) $11.016 $10.614 (5947) $3,154 (5166) 512621 $5.77 53.948 $18.124 $1270 S945) 52.471 $1.307 54573 554 403 ($17.540) $14.000 $11.660) $23.700) $20.890) 50 $0 $10.633 50 $6.501 SO 50 50 $0 (57.3401 50 53,136 50 $4704 50 50 50 ST 300 50 $2.000 (5500) $16,100 $2.500) 50 $0 (51.178) S8.000 50 50.800 SO 50 50 $0 88888888 55500 50 SO 520.000 54.300 57213 Digby Financial Summary Cash Flow Statement Survey Cashflows from operating activities Net Income Loss) Adjustment for non-cash toms: Depreciation Extraordinary gains fosses/writeofts Changes in current assets and abilities Accounts payable Inventory Accounts Receivable Net cash from operations Cash flows from investing activities Plant improvements net) Cash flows from financing activities Dividends paid Sales of common stock Purchase of common stock Cash from long term debt issued Earty retirement of long term debit Retirement of current et Cash from current debt borrowing Cash from emergency loan Net cash from financing activities Net change in cash position Balance Sheet Survey Cash Accounts Receivable Inventory Tot Current Assets Plant and equipment Accumulated Depreciation Total Fixed Assets Total Assets Accounts Payable Current Debt Total Current Liabilities Long Term Debe Total Liabilities Common Stock Retained Earings Total Equity Total Liabilities & Owners Equity Income Statement Survey Variable Costs Labor Material Carry) Contribution Margin Depreciation SGARSD Promo, Sales Admin) Other Fees Writeo TOM Bonuses) EBIT Interest Short term.Long term Totes Profit Sharing Net Profit FOUNDATION FAST TRACK $17.134 $10.610 Andrews $31.824 $11.186 $3.220 $46.238 $7.840 $12.627 Baldwin $28.541 $8.450 $12.847 549.345 558.100 (520 444) 537656 587 501 $13.000 $17.124 Chester $17.972 $15.03 56.124 $38.519 599 200 (527.0833 $72.117 $111.03 51.680 $18.722 97426 Erie $14,602 39354 57.190 $31,157 55.678 $4375 $12972 Ferris $17.224 $10.118 $17.933 $45.294 573.090 (522 543) 550.547 $96.786 554000 518.432) $35.558 558,300 521563) 566737 570.660 520.7203 $49.940 597 895 $95.215 53.518 $2.000 $6.118 52.820 $2.500 55.428 521.210 $1.733 56.580 52.600 $9.89 54.925 $2.500 ST 525 $30.047 $37.572 $11.250 $2.000 $13.858 $30,304 544.162 $28.836 $23.787 $52.624 $96.786 $24.675 $30,793 551,7 553.481 $26.966 $36.155 527 410 529 298 556700 $87.501 $36.651 $58, 155 $31.530 528.793 560,323 597 895 $38.184 520.875 $59.050 $95.215 Sales Andrews $102,066 $67.785 354283 $4,873 $13.744 SOSY $14.800 53.682 53,895 $145 $7.088 Baldwin 577 150 $47490 $29.682 $3.873 $12.232 5392 $13.184 52.657 $3.654 $137 $6.706 $111.835 Chester $112.50 $67,919 514.670 $8,613 $16.604 5804 $20.548 $5.500 55.256 5196 $25.285 516.80 542.175 568.354 Digby 59.0 $45.555 $23.505 $1.00 $13.223 3977 $5.705 $2.569 Erie $110.248 569. 125 S61.123 $5.887 $18.429 $895 $15.912 $3.254 54427 $164 $8.057 Ferra $92.325 561.526 5.30799 $4.711 554940 $1.045 $10.095 52.900 $2.488 $92 $4.527 Page 3 $1.00 Production Analysis Fast Track F122766 Round: 6 Dec. 31, 2026 Production Vs. Capacity F122766 Andrews Baldwin Chester Digby Erie Farris 500 2.000 2.500 3.000 1.000 o Capacity 1.500 Production 2nd Name Able Astra Aloha Primary Segment LOW Low High High Low High High Low High High mation Ne Round 90 8.0 10 10 100 2.0 20 Capacity Neat Plan Bound 1000 32% 630 164 75% 300 1545 980 1969 530 849 400 Blue Bronce 100 45 Crunch Com Case Un Units inven Revision A Sue Sold Soy Date Dec.31 MTBE Cord CoordPrice 1140 178 5282025 3.6 20000 73 884 127 $12.00 6/21/2025 28 20000 80 120 33.00 381 3 618/2020 14 21000 107 93 $43.00 O 6102025 13 22000 91 5350 184 712025 32 20000 71 129 53150 444 1978/20/2020 1520000 113 8.5 544 50 456 127 6202026 14 22000 110 81 54500 1387 63 $182025 29 20000 75 125 529 50 582 67 6/13/2020 14 23000 114 86 542 50 602 65 6/12026 12 23000 115 85 $43.50 160/12026 10 23000 116 84 54400 211 11102025 32 20000 73 12.7 $33.00 556 13 12025 15 23000 11.6 84 444.00 0 517,2026 115 8.4 142.00 301 226 2027 47 20000 12 $32.00 1,053 29 192026 26 20000 78 12.1 $3300 548 7/11/2006 15 23000 116 84 $44.00 03/15/2021 12 23000 116 84 54450 1.187 437 10/2025 30 20000 70 130 $3200 460 118 6202020 85 23000 10T 91 H 429 134 792026 1.5 23000 112 88 54500 104 3/7/2020 08 20000 75 125 53300 & Mana Labor Com Cost Good Morg me $10.1956.96 4 511.46 5942 35% 100% 516 68 51521 0% $17.35 $58 12 $9.83 5455 51% 11 $17.66 $12.14 $19.08 51274 20 0% 510 555140 58% 0% $18.56 $10.52 04 $18.74 $1131 30% 19% $18.92 $12.02 510 19 3778 09 $18.92 393.44 20% 0% $18.82 $15.30 $9.95661 44% 56% $11.195663 40% $18.92 51271 27% $18.2 51305 27% 65 $9.64 $6.00 47% 745 $17.47 $12.54 30% 0 $18.19 $15.10 23% 34% $10.55 $15.8 16% 100% 1200 650 81% 600 11 500 55 D Dory Dede Low High High 70 20 15 1200 500 400 LOW 1551 Low 100 100 700 Eau Ewa Exit 15 75% 105 Fast Fiora Feue High High Low High High 8.5 30 2.0 3.0 400 1200 425 365 971 93% 1324 FOUNDATION FAST TRACK Page 4 Round: 6 Dec. 31, 2026 2. Age Foto Low Tech Segment Analysis Fast Track F122766 Low Tech Statistics Accessibility F122766 Low Tech Total Industry Unit Demand 8.929 Actual Industry Unit Sales 18.929 Andrews Segment % of Total Industry 158.1% Baldwin Next Year's Segment Growth Rate 110.0% Chester Low Tech Customer Buying Criteria Digby Expectations Importance Erie 1. Price $15.00 - 35.00 41% Ideal Age - 3.0 29% Ferris 3. Reliability MTBF 14000-20000 21% 4. Ideal Position Pimn 78 Size 122 9% Perceptual Map for Low Tech Actual vs Potential Market Share 20 Perceptual map (at end of this year) 2026 F122766 Low Tech 18 20% 10 18% 16% 14% 12 12% 10% 10 8% 6% 4% 14 Iuli Size 00 0% 0 2 Name Cake Fast Baker Daze Market Share 15% 13% 13% 13% 12% 115 11% 9% 6 8 10 12 14 16 18 20 Actual Potential Performance Top Products in Low Tech Segment Units Cust Cust Dec Sold to Revision Stock Pim Size Age Promo Aware Sales Access Cust Seg Date Out Coord Coord Price MTBF Dec 31 Budget Dess Budget Ibility Survey 1.296 5/18/2026 7.5 12.5 $29.50 20000 2.88 $1.400 100% $3,000 90% 57 1,178 6/10/2025 7.0 13.0 532.00 20000 3.57 $1400 100% $3.000 88% 41 1,152 7/12/2025 7.1 129 $31.50 20000 3.20 $1,400 100% $2.500 81% 1.125 11/8/2025 7.3 12.7 $33,00 20000 3.15 $1.400 100% $3,000 90% 43 1.105 5/28/2025 7.3 12.7 $32.00 20000 3.56 $1.400 99% $2.000 77% 40 970 6/11/2026 78 12.1 $33,00 20000 261 $1.400 100% $1.000 92% 41 961 2/26/2027 7.1 129 $32,00 20000 4.68 $1,400 100% $3,000 92% 29 771 6/21/2025 YES BO 12.0 $33.00 20000 283 $1,400 95% $1.000 77% 358 3/17/2026 7.5 12.5 $33.00 20000 0.79 $2.000 70%. SO 885 18 9 6/18/2026 10.7 $43.00 21000 1.44 $1,400 88% $1.000 77% 2 6/26/2026 10.7 9.1 $44.50 23000 1.54 $1,400 100% $3.000 88% 2 6/18/2026 10.9 9.1 $43.50 22000 1.33 $2.000 56% $1.000 77% Able E3la Eat Astra Fiat Aloha Flora Angel 0% 0% 0% Round: 6 Dec. 31, 2026 High Tech Segment Analysis Fast Track F122766 High Tech Statistics Accessibility F122765 High Tech Total Industry Unit Demand 8.450 Actual Industry Unit Sales 16,450 Andrews Segment of Total Industry 141.9% Baldwin Next Year's Segment Growth Rate 20.0% Chester High Tech Customer Buying Criteria Digby Expectations importance Erie 1. Ideal Position Pimn 11.6 Size 8.4 33% 2. Age Ideal Age = 0.0 29% Ferris 3. Price $25.00 - 45.00 4. Reliability MTBF 17000-23000 13% Perceptual Map for High Tech Actual vs Potential Market Share Perceptual map (at end of this year) 2026 F122766 High Tech 20 25% 18 16 20% 14 12 15% Size 10 10% 5% 0% 0 2 4 Cust Dec Market Share 9% 9% 9% 8 10 12 14 16 18 20 Actual Potential Performance Top Products in High Tech Segment Units Cust Sold to Revision Stock Pim Size Age Promo Aware Sales Access Cust Seg Date Out Coord Coord Price MTBF Dec 31 Budget Budget Ibility Survey 602 6/13/2026 11.5 8.5 $43.50 23000 121 $1.750 100% $1,000 95% 52 562 6/13/2026 114 8.6 $42.50 23000 1.45 $1.400 100% $1.000 95% 50 556 6/18/2026 11.6 8.4 $44.00 23000 1.45 $1400 100% $3.000 96% 50 548 7/1/2026 YES 11.6 $44.00 23000 146 $1400 100% $3,000 98% 51 525 10/19/2026 116 84 $44,00 23000 0.96 $2.000 92% $1.000 95% 53 459 6/18/2026 10.9 9.1 $43.50 22000 1.33 $2.000 96% $1,000 96% 40 458 8/26/2026 10.7 9.1 $44.50 23000 154 $1.400 100% $3,000 95% 41 456 6/2012026 11.8 8.1 $45.00 22000 1.40 $1,400 100% $1,000 95% 447 3/15/2026 YES 11.6 $44.50 23000 1.16 $2.000 92% $1.000 98% 6/20/2026 11.3 8.5 $44 50 20000 1.46 $1.400 100% $2,000 95% 40 429 7/9/2026 112 88 $45.00 23000 1.50 $1,400 100% SO 95% 40 371 8/18/2026 10.7 9.3 $43.00 21000 1.44 51 400 88% $1,000 96% 32 9% Name Cora Crunch Dory Ewta Castle Angel Flora Bronze Exit Blue Fekra 84 8% 7% 7% 7% 7% 7% 7% 6% Aloha Market Share Fast Track F122766 Market Share F122766 Round: 6 Dec 31, 2026 Units Sold vs Demand Chart F122766 8.000 6.000 4.000 2.000 20% 10% 0% wapy Low Low High Industry Unit Sales Total Unt Demand Actual Market Share in Units of Market Potential Market Share in Units Industry United 8920 High 6.450 41.9% Low 4.929 58.1% High 6.450 41.9% Total 15.378 100.0% 7 Abie Astra Aloha Angel 8.6% 0.1% 9.94 2115 129 2224 12.7% 20% 5.5 6.8% 1485 03% TAN 5.8% 7.1% 152 0.3% 6.9% 7.1% 1425 06% 8.7% 0.3% Blue Bronze Total Total 15.37 Un Demande 1000 Martel TAS Aile 58% Astra 25% Aloha 30 Angel 18. Tot Toler 293 3.0 Bron 135 | Total Cake 38 Crunch 303 Com 34% Castle 1975 Tot TOD 16 Dory 10 Dodo 12:15 Total 6.6% 20 29 19.15 7.5 2.7% 20% 13.15 127 13.8% 12.99 143 Com 8.6% 3.5% 3.7% 33 19.0% 14.5 Cake Crunch Castle To Daze Dary Dede Tot EM E 14.3% 124% 06% 8.6% 2.3 8.9% 7.8% 25.6% 0.6% 82 515 13.9% 7.4% 3.45 2.15 13.0 124 100% 101 10.0 10.9% 02 8.15 62% 68% 145 34% 19 02% 14% 85% 17.15 0.1% 7.1% 21.6 13.2% 17. Exit To Fast Fion Fera F! Total 6.9% Bowie 205 10. To 7.15 Fai 20 Fira 28 Fe 29% Fiat 16.4% 2134 130% 7.6 28% 13% 15.2% 172 614 12% 14.4% 3.9% 17.0% 28% 15.9% CFOUNDATIONEL-ASTTRACK Page 2 Perceptual Map Round: 6 Dec. 31, 2026 FastTrack F122766 Perceptual Map for All Segments Perceptual map (at end of this year) 20 18 16 14 12 exia Size 10 8 N 2 4 6 8 10 12 14 16 18 20 Andrews Pimn Size 73 12.7 107 9.3 109 9.1 Name Able Astra Aloha Angel 129 Performance Baldwin Pimn Sue Revised Name 7.1 7/12/2025 Cake 8.5 6/20/2026 Crunch 118 8.1 6/20/2026 Cora Chester Pimn Sie 75 125 114 11.5 85 11.6 Revised Name 528 2025 Baker 6/21/2025 Blue 6/18/2026 Bronze 6/18/2020 80 120 113 86 Revised 5/18/2026 6/13/2026 6/13/2026 10/19/2020 Castle Digby Ferris Pimn Name Daze Dory Dodo 73 Size 12.7 8.4 8.4 Erie Pimn Size 7.1 121 11.6 8.4 11.6 84 129 Size 13.0 116 Revised Name 11/8/2025 Eat 6/18/2020 Esta 5/17/2028 Ewta Ext 7. Revised Name 226/2027 Fast 6/11/2025 Flora 7/1/2026 Fekra 3/15/2025 Fiat Pimn 70 10.7 112 75 Revised 6/10/2025 8/20/2020 7/9/2020 3/17/2026 11.6 8.8 125 FOUNDATION FAST TRACK Page 8 On December 3rd 2016, Mostafa, EMA-INK'S CEO, has just finished a meeting with the company's top executives following a month of many changes that had a huge effect on the company's wealth and stability. It has been one month since the central bank of Egypt has announced the devaluation of the Egyptian pound to reach a value of 18 EGP USS up from 8.88 EGP USS which constitutes a tremendous change in the currency exchange rate The company performance has been very good since its starting with a constant growth from year to year as it enjoys a leading market position against some local competitors especially that it is not easy to figure out a good know-how for manufacturing inks for new competitors. In 2011, and after the Egyptian revolution, the company sales prowth has begun to slow down with the presence of lower-priced competitors and the economic downturn that happened to Egypt. EMA-INK story started in 1980 by three brothers as a dream to have their own ink brand name. They hence started their first production Site of Flexographic Inks'in Egypt with a small set of mixers and good starting formulations to begin their production and distribution operations EMA-INK extended its success 60 33 other countries around the world with its flexo printing materials. The key competitive advantage of EMA-INK is its responsiveness. A highly qualified technical support team equips the company which allows high responsiveness to their clients changing requests of various drying speeds, physical properties and continuously diverse substrates The main company products comprise water-based inks, varnishes and additives in addition to high quality pigment color concentrates, covering the mod color indexes for the pigments used in manufacturing water-based flexographic inks, enabling therefore their clients to be free to adjust their own custom formulations. The company however, suffers from a big cash deficit due to the long money cycle whereby large customers who represent almost 85% of the market force the company to receive their invoices after 120 days which hinder the company's growth. On the other hand the company suppliers are very few with good quality and hence dictate the pricing for the raw material and request their payment in advance. Furthermore, the employee turnover rate is very high which poses a big challenge on the company to sustain the trained workforce and pushes the company to give somehow above-average salaries in an attempt to retain its employees Mostafa is a very interesting CEO. He is fond of sports and encourages his employees to adopt a healthy lifestyle. Within EMA inks, employees are encouraged by Mostafa to play a role in making important company decisions through extensive discussions and brainstorming. This is also fostered by the fact that a lot of them have deep knowledge about their field and the solutions that they come up with are in most of the times better than the ones Mostafa proposes A report generated by Economist Intelligence Unit Limited, gave very promising estimates on the economic performance of Egypt since the flotation of the Egyptian pound done on November 3rd 2016. Moreover, the company was thinking of expanding in the parts market which is very close to the inks manufacturing industry since the company possesses a very strong know-how in the pigments industry that could enable the company to be a lucrative player in the decorative paints industry. This was also internally encouraged given the information received about a strong multinational ink manufacturer intending to make a groen-field investment in the Egyptian market Types of inks used to print on cartoons which may affect the company's current position. The paint industry has high prospective growth expectations as seen in the below table Actual Forecasted Year 2015 2016 2017 2018 2019 2020 Paints Sales (USSMA) 7062 8557 958,36 1073.4 1202.169 Mostafa will definitely seek help of his subordinates on whether to invest in paints industry or expand his business in other countries... Case Questions 1. In light of the case above, analyze the industry in which EMA Ink's is operating using Porter's five forces Model? (S Points) 2. Conduct SWOT analysis for EMA Ink's using evidence from the case. (5 Points) 3. According to Behavioral Theory of Leadership what type of leadership style does Mostafa have? (5 points) 4. What recommendation would you give to Mostafa. Should be go for the paints industry or expand in other countries. Please indicate the corporate strategy Corresponding to your choice Justify your answers (5 Points) You are given information from the Foundation FastTrack F122766 - R6 pp.3-8 in a separate handout. Use the information given to answer the following questions. Always explain the reasons and justification for your answer, show in detail all calculations you made and walk me through your rationale so that you show me you understand. Answer as if you are explaining to a student who does not have background about what you are explaining. 5. Explain Baldwin's overall competitive strategy and that for each of its products? Justify your answer using information from the Foundation FastTrack provided on the functional decisions that Baldwin has adopted for each product for the following three functional departments (R&D, marketing and production). Please feel free to criticize any functional decision that doesn't match the competitive strategy. After you have done this, please draw your final conclusion (15 points) 6. Below is a snapshot of a historical income statement of the six companies in Round 3. Please comment in details showing your calculations on the change that ANDREWS has been able to make in its profitability indicators by comparing its current performance (i.e. the current round) to its performance in round 3. (10 Points) Baldwin 566,153 $45,128 $21,025 $2.500 Income Statement Survey Sales Variable Costs Labor Material.Cary) Contribution Margin Depreciation SGAR&D Promo, Sales, Admin) Other Fees Writeos, TOM,Bonuses) EBIT Interest(Short term Long torm) Taxes Profit Sharing Net Profit FOUNDATION FAST TRACK Andrews $58,394 $40,872 $17,522 $2.719 $10,817 $513 $3,473 $2,928 $190 $7 $347 $13,665 $545 $4,235 $1,680 $894 Chester $56,912 $34,598 $22,314 $2.764 $13,806 $637 $5,107 $2,139 $1,039 $39 $1,891 Digby $62,118 $45,404 $16,714 $2.507 $11,745 $375 $2,087 $4,532 (5855) 50 ($1,589) Erle $77.221 $54,295 $22.920 $2,433 $12.803 $398 $7,291 $1,782 $1,928 $72 $3,509 Ferris $61,523 $44,072 $17,451 $2,291 $12.770 $435 $1,956 $2.036 (528) $0 (552) Page 3 $33 $1,627 7. By looking at the production analysis page, one can note that ASTRA of the company ANDREWS had a 184% plant utilization and has produced 884 units with O units remaining in inventory. (15 Points) a. Assuming that the company did not have any inventory of this product from the previous round ( Round 5), calculate the capacity of ASTRA ( 5 Points) b. What will be the market share of the product ASTRA next round? Please use advanced forecasting and show all your calculations (6 points) c. In the case the company produces in Round 7 (next round) its forecasted sales calculated in part b what will the plant utilization be? Is it good or bad? (4 points) Fast Track F122766 Round: 6 Dec. 31, 2026 Andrews Baldwin Chester Digby Erie Ferris $7.088 $6.705 59.584 58.057 54527 $1934 53.600 $4,873 50 55.873 56,613 353 $5.387 50 54.711 50 $3.354 $1.087 ($3,242) $11.016 $10.614 (5947) $3,154 (5166) 512621 $5.77 53.948 $18.124 $1270 S945) 52.471 $1.307 54573 554 403 ($17.540) $14.000 $11.660) $23.700) $20.890) 50 $0 $10.633 50 $6.501 SO 50 50 $0 (57.3401 50 53,136 50 $4704 50 50 50 ST 300 50 $2.000 (5500) $16,100 $2.500) 50 $0 (51.178) S8.000 50 50.800 SO 50 50 $0 88888888 55500 50 SO 520.000 54.300 57213 Digby Financial Summary Cash Flow Statement Survey Cashflows from operating activities Net Income Loss) Adjustment for non-cash toms: Depreciation Extraordinary gains fosses/writeofts Changes in current assets and abilities Accounts payable Inventory Accounts Receivable Net cash from operations Cash flows from investing activities Plant improvements net) Cash flows from financing activities Dividends paid Sales of common stock Purchase of common stock Cash from long term debt issued Earty retirement of long term debit Retirement of current et Cash from current debt borrowing Cash from emergency loan Net cash from financing activities Net change in cash position Balance Sheet Survey Cash Accounts Receivable Inventory Tot Current Assets Plant and equipment Accumulated Depreciation Total Fixed Assets Total Assets Accounts Payable Current Debt Total Current Liabilities Long Term Debe Total Liabilities Common Stock Retained Earings Total Equity Total Liabilities & Owners Equity Income Statement Survey Variable Costs Labor Material Carry) Contribution Margin Depreciation SGARSD Promo, Sales Admin) Other Fees Writeo TOM Bonuses) EBIT Interest Short term.Long term Totes Profit Sharing Net Profit FOUNDATION FAST TRACK $17.134 $10.610 Andrews $31.824 $11.186 $3.220 $46.238 $7.840 $12.627 Baldwin $28.541 $8.450 $12.847 549.345 558.100 (520 444) 537656 587 501 $13.000 $17.124 Chester $17.972 $15.03 56.124 $38.519 599 200 (527.0833 $72.117 $111.03 51.680 $18.722 97426 Erie $14,602 39354 57.190 $31,157 55.678 $4375 $12972 Ferris $17.224 $10.118 $17.933 $45.294 573.090 (522 543) 550.547 $96.786 554000 518.432) $35.558 558,300 521563) 566737 570.660 520.7203 $49.940 597 895 $95.215 53.518 $2.000 $6.118 52.820 $2.500 55.428 521.210 $1.733 56.580 52.600 $9.89 54.925 $2.500 ST 525 $30.047 $37.572 $11.250 $2.000 $13.858 $30,304 544.162 $28.836 $23.787 $52.624 $96.786 $24.675 $30,793 551,7 553.481 $26.966 $36.155 527 410 529 298 556700 $87.501 $36.651 $58, 155 $31.530 528.793 560,323 597 895 $38.184 520.875 $59.050 $95.215 Sales Andrews $102,066 $67.785 354283 $4,873 $13.744 SOSY $14.800 53.682 53,895 $145 $7.088 Baldwin 577 150 $47490 $29.682 $3.873 $12.232 5392 $13.184 52.657 $3.654 $137 $6.706 $111.835 Chester $112.50 $67,919 514.670 $8,613 $16.604 5804 $20.548 $5.500 55.256 5196 $25.285 516.80 542.175 568.354 Digby 59.0 $45.555 $23.505 $1.00 $13.223 3977 $5.705 $2.569 Erie $110.248 569. 125 S61.123 $5.887 $18.429 $895 $15.912 $3.254 54427 $164 $8.057 Ferra $92.325 561.526 5.30799 $4.711 554940 $1.045 $10.095 52.900 $2.488 $92 $4.527 Page 3 $1.00 Production Analysis Fast Track F122766 Round: 6 Dec. 31, 2026 Production Vs. Capacity F122766 Andrews Baldwin Chester Digby Erie Farris 500 2.000 2.500 3.000 1.000 o Capacity 1.500 Production 2nd Name Able Astra Aloha Primary Segment LOW Low High High Low High High Low High High mation Ne Round 90 8.0 10 10 100 2.0 20 Capacity Neat Plan Bound 1000 32% 630 164 75% 300 1545 980 1969 530 849 400 Blue Bronce 100 45 Crunch Com Case Un Units inven Revision A Sue Sold Soy Date Dec.31 MTBE Cord CoordPrice 1140 178 5282025 3.6 20000 73 884 127 $12.00 6/21/2025 28 20000 80 120 33.00 381 3 618/2020 14 21000 107 93 $43.00 O 6102025 13 22000 91 5350 184 712025 32 20000 71 129 53150 444 1978/20/2020 1520000 113 8.5 544 50 456 127 6202026 14 22000 110 81 54500 1387 63 $182025 29 20000 75 125 529 50 582 67 6/13/2020 14 23000 114 86 542 50 602 65 6/12026 12 23000 115 85 $43.50 160/12026 10 23000 116 84 54400 211 11102025 32 20000 73 12.7 $33.00 556 13 12025 15 23000 11.6 84 444.00 0 517,2026 115 8.4 142.00 301 226 2027 47 20000 12 $32.00 1,053 29 192026 26 20000 78 12.1 $3300 548 7/11/2006 15 23000 116 84 $44.00 03/15/2021 12 23000 116 84 54450 1.187 437 10/2025 30 20000 70 130 $3200 460 118 6202020 85 23000 10T 91 H 429 134 792026 1.5 23000 112 88 54500 104 3/7/2020 08 20000 75 125 53300 & Mana Labor Com Cost Good Morg me $10.1956.96 4 511.46 5942 35% 100% 516 68 51521 0% $17.35 $58 12 $9.83 5455 51% 11 $17.66 $12.14 $19.08 51274 20 0% 510 555140 58% 0% $18.56 $10.52 04 $18.74 $1131 30% 19% $18.92 $12.02 510 19 3778 09 $18.92 393.44 20% 0% $18.82 $15.30 $9.95661 44% 56% $11.195663 40% $18.92 51271 27% $18.2 51305 27% 65 $9.64 $6.00 47% 745 $17.47 $12.54 30% 0 $18.19 $15.10 23% 34% $10.55 $15.8 16% 100% 1200 650 81% 600 11 500 55 D Dory Dede Low High High 70 20 15 1200 500 400 LOW 1551 Low 100 100 700 Eau Ewa Exit 15 75% 105 Fast Fiora Feue High High Low High High 8.5 30 2.0 3.0 400 1200 425 365 971 93% 1324 FOUNDATION FAST TRACK Page 4 Round: 6 Dec. 31, 2026 2. Age Foto Low Tech Segment Analysis Fast Track F122766 Low Tech Statistics Accessibility F122766 Low Tech Total Industry Unit Demand 8.929 Actual Industry Unit Sales 18.929 Andrews Segment % of Total Industry 158.1% Baldwin Next Year's Segment Growth Rate 110.0% Chester Low Tech Customer Buying Criteria Digby Expectations Importance Erie 1. Price $15.00 - 35.00 41% Ideal Age - 3.0 29% Ferris 3. Reliability MTBF 14000-20000 21% 4. Ideal Position Pimn 78 Size 122 9% Perceptual Map for Low Tech Actual vs Potential Market Share 20 Perceptual map (at end of this year) 2026 F122766 Low Tech 18 20% 10 18% 16% 14% 12 12% 10% 10 8% 6% 4% 14 Iuli Size 00 0% 0 2 Name Cake Fast Baker Daze Market Share 15% 13% 13% 13% 12% 115 11% 9% 6 8 10 12 14 16 18 20 Actual Potential Performance Top Products in Low Tech Segment Units Cust Cust Dec Sold to Revision Stock Pim Size Age Promo Aware Sales Access Cust Seg Date Out Coord Coord Price MTBF Dec 31 Budget Dess Budget Ibility Survey 1.296 5/18/2026 7.5 12.5 $29.50 20000 2.88 $1.400 100% $3,000 90% 57 1,178 6/10/2025 7.0 13.0 532.00 20000 3.57 $1400 100% $3.000 88% 41 1,152 7/12/2025 7.1 129 $31.50 20000 3.20 $1,400 100% $2.500 81% 1.125 11/8/2025 7.3 12.7 $33,00 20000 3.15 $1.400 100% $3,000 90% 43 1.105 5/28/2025 7.3 12.7 $32.00 20000 3.56 $1.400 99% $2.000 77% 40 970 6/11/2026 78 12.1 $33,00 20000 261 $1.400 100% $1.000 92% 41 961 2/26/2027 7.1 129 $32,00 20000 4.68 $1,400 100% $3,000 92% 29 771 6/21/2025 YES BO 12.0 $33.00 20000 283 $1,400 95% $1.000 77% 358 3/17/2026 7.5 12.5 $33.00 20000 0.79 $2.000 70%. SO 885 18 9 6/18/2026 10.7 $43.00 21000 1.44 $1,400 88% $1.000 77% 2 6/26/2026 10.7 9.1 $44.50 23000 1.54 $1,400 100% $3.000 88% 2 6/18/2026 10.9 9.1 $43.50 22000 1.33 $2.000 56% $1.000 77% Able E3la Eat Astra Fiat Aloha Flora Angel 0% 0% 0% Round: 6 Dec. 31, 2026 High Tech Segment Analysis Fast Track F122766 High Tech Statistics Accessibility F122765 High Tech Total Industry Unit Demand 8.450 Actual Industry Unit Sales 16,450 Andrews Segment of Total Industry 141.9% Baldwin Next Year's Segment Growth Rate 20.0% Chester High Tech Customer Buying Criteria Digby Expectations importance Erie 1. Ideal Position Pimn 11.6 Size 8.4 33% 2. Age Ideal Age = 0.0 29% Ferris 3. Price $25.00 - 45.00 4. Reliability MTBF 17000-23000 13% Perceptual Map for High Tech Actual vs Potential Market Share Perceptual map (at end of this year) 2026 F122766 High Tech 20 25% 18 16 20% 14 12 15% Size 10 10% 5% 0% 0 2 4 Cust Dec Market Share 9% 9% 9% 8 10 12 14 16 18 20 Actual Potential Performance Top Products in High Tech Segment Units Cust Sold to Revision Stock Pim Size Age Promo Aware Sales Access Cust Seg Date Out Coord Coord Price MTBF Dec 31 Budget Budget Ibility Survey 602 6/13/2026 11.5 8.5 $43.50 23000 121 $1.750 100% $1,000 95% 52 562 6/13/2026 114 8.6 $42.50 23000 1.45 $1.400 100% $1.000 95% 50 556 6/18/2026 11.6 8.4 $44.00 23000 1.45 $1400 100% $3.000 96% 50 548 7/1/2026 YES 11.6 $44.00 23000 146 $1400 100% $3,000 98% 51 525 10/19/2026 116 84 $44,00 23000 0.96 $2.000 92% $1.000 95% 53 459 6/18/2026 10.9 9.1 $43.50 22000 1.33 $2.000 96% $1,000 96% 40 458 8/26/2026 10.7 9.1 $44.50 23000 154 $1.400 100% $3,000 95% 41 456 6/2012026 11.8 8.1 $45.00 22000 1.40 $1,400 100% $1,000 95% 447 3/15/2026 YES 11.6 $44.50 23000 1.16 $2.000 92% $1.000 98% 6/20/2026 11.3 8.5 $44 50 20000 1.46 $1.400 100% $2,000 95% 40 429 7/9/2026 112 88 $45.00 23000 1.50 $1,400 100% SO 95% 40 371 8/18/2026 10.7 9.3 $43.00 21000 1.44 51 400 88% $1,000 96% 32 9% Name Cora Crunch Dory Ewta Castle Angel Flora Bronze Exit Blue Fekra 84 8% 7% 7% 7% 7% 7% 7% 6% Aloha Market Share Fast Track F122766 Market Share F122766 Round: 6 Dec 31, 2026 Units Sold vs Demand Chart F122766 8.000 6.000 4.000 2.000 20% 10% 0% wapy Low Low High Industry Unit Sales Total Unt Demand Actual Market Share in Units of Market Potential Market Share in Units Industry United 8920 High 6.450 41.9% Low 4.929 58.1% High 6.450 41.9% Total 15.378 100.0% 7 Abie Astra Aloha Angel 8.6% 0.1% 9.94 2115 129 2224 12.7% 20% 5.5 6.8% 1485 03% TAN 5.8% 7.1% 152 0.3% 6.9% 7.1% 1425 06% 8.7% 0.3% Blue Bronze Total Total 15.37 Un Demande 1000 Martel TAS Aile 58% Astra 25% Aloha 30 Angel 18. Tot Toler 293 3.0 Bron 135 | Total Cake 38 Crunch 303 Com 34% Castle 1975 Tot TOD 16 Dory 10 Dodo 12:15 Total 6.6% 20 29 19.15 7.5 2.7% 20% 13.15 127 13.8% 12.99 143 Com 8.6% 3.5% 3.7% 33 19.0% 14.5 Cake Crunch Castle To Daze Dary Dede Tot EM E 14.3% 124% 06% 8.6% 2.3 8.9% 7.8% 25.6% 0.6% 82 515 13.9% 7.4% 3.45 2.15 13.0 124 100% 101 10.0 10.9% 02 8.15 62% 68% 145 34% 19 02% 14% 85% 17.15 0.1% 7.1% 21.6 13.2% 17. Exit To Fast Fion Fera F! Total 6.9% Bowie 205 10. To 7.15 Fai 20 Fira 28 Fe 29% Fiat 16.4% 2134 130% 7.6 28% 13% 15.2% 172 614 12% 14.4% 3.9% 17.0% 28% 15.9% CFOUNDATIONEL-ASTTRACK Page 2 Perceptual Map Round: 6 Dec. 31, 2026 FastTrack F122766 Perceptual Map for All Segments Perceptual map (at end of this year) 20 18 16 14 12 exia Size 10 8 N 2 4 6 8 10 12 14 16 18 20 Andrews Pimn Size 73 12.7 107 9.3 109 9.1 Name Able Astra Aloha Angel 129 Performance Baldwin Pimn Sue Revised Name 7.1 7/12/2025 Cake 8.5 6/20/2026 Crunch 118 8.1 6/20/2026 Cora Chester Pimn Sie 75 125 114 11.5 85 11.6 Revised Name 528 2025 Baker 6/21/2025 Blue 6/18/2026 Bronze 6/18/2020 80 120 113 86 Revised 5/18/2026 6/13/2026 6/13/2026 10/19/2020 Castle Digby Ferris Pimn Name Daze Dory Dodo 73 Size 12.7 8.4 8.4 Erie Pimn Size 7.1 121 11.6 8.4 11.6 84 129 Size 13.0 116 Revised Name 11/8/2025 Eat 6/18/2020 Esta 5/17/2028 Ewta Ext 7. Revised Name 226/2027 Fast 6/11/2025 Flora 7/1/2026 Fekra 3/15/2025 Fiat Pimn 70 10.7 112 75 Revised 6/10/2025 8/20/2020 7/9/2020 3/17/2026 11.6 8.8 125 FOUNDATION FAST TRACK Page 8
