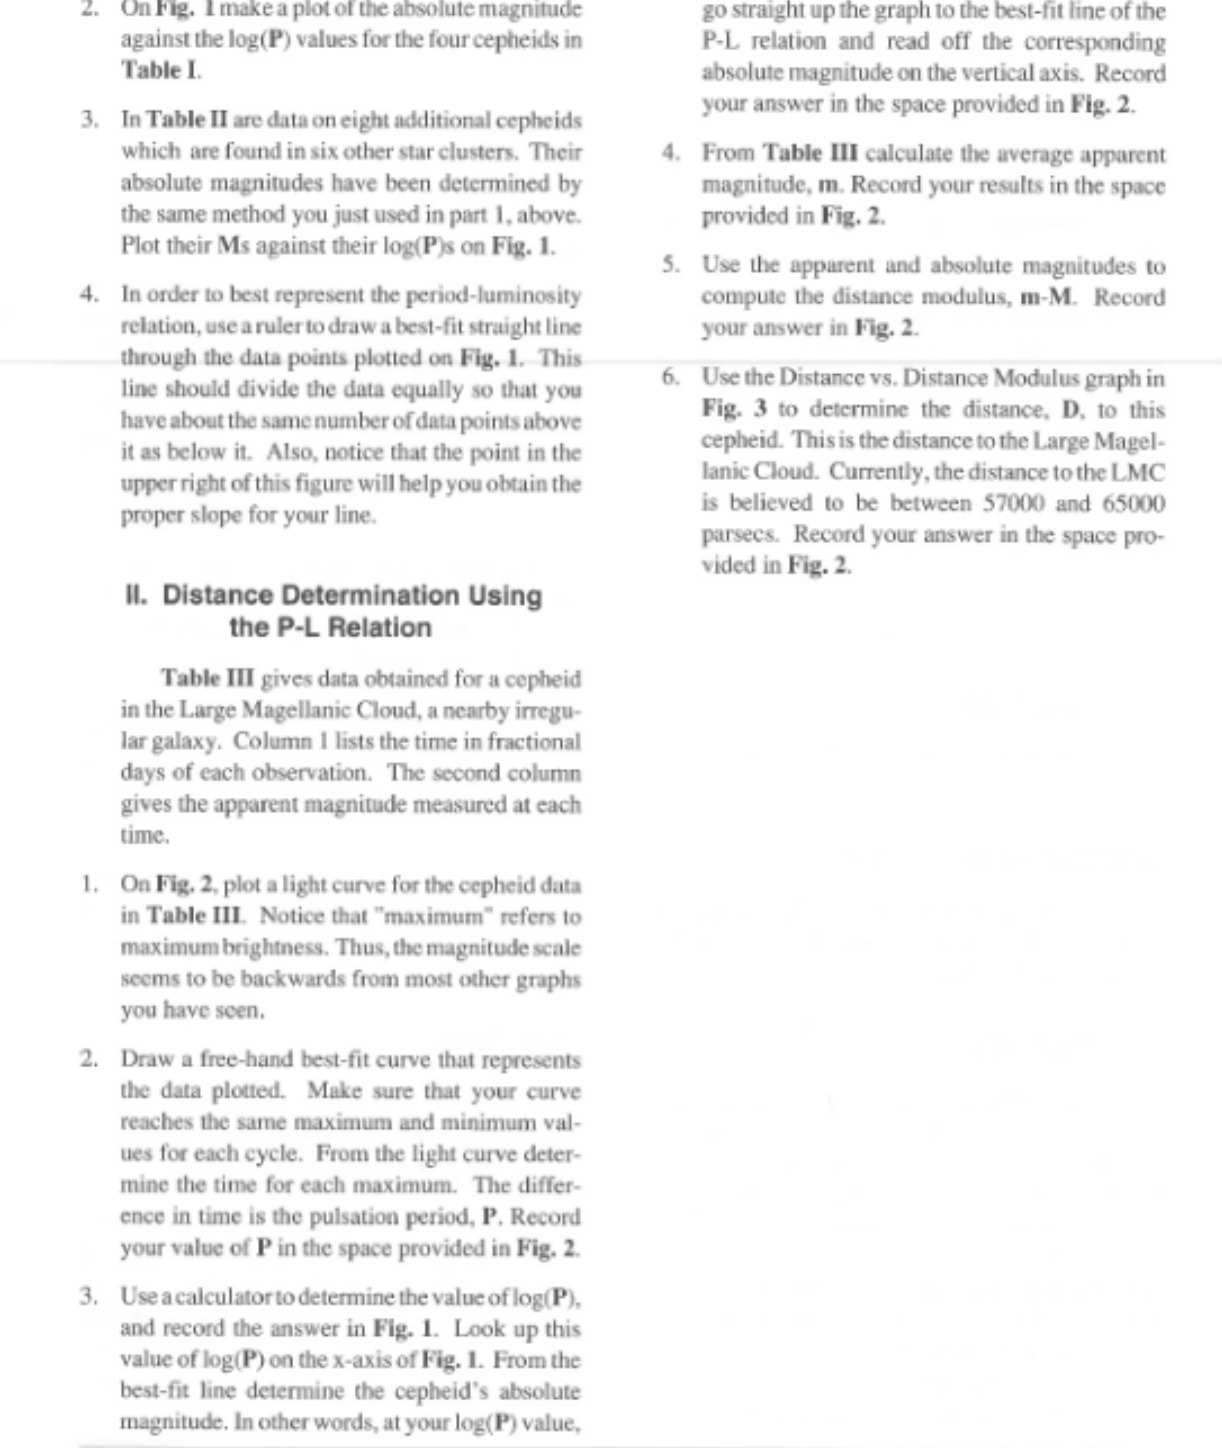
On Fig. I make a plot of the absolute magnitude go straight up the graph to the best-fit line of the against the log(P) values for the four cepheids in P-L relation and read off the corresponding Table I. absolute magnitude on the vertical axis. Record 3. In Table II are data on eight additional cepheids your answer in the space provided in Fig. 2. which are found in six other star clusters. Their 4. From Table III calculate the average apparent absolute magnitudes have been determined by magnitude, m. Record your results in the space the same method you just used in part 1, above. provided in Fig. 2. Plot their Ms against their log(P)s on Fig. 1. 5. Use the apparent and absolute magnitudes to 4. In order to best represent the period-luminosity compute the distance modulus, m-M. Record relation, use a ruler to draw a best-fit straight line your answer in Fig. 2. through the data points plotted on Fig. 1. This line should divide the data equally so that you 6. Use the Distance vs. Distance Modulus graph in have about the same number of data points above Fig. 3 to determine the distance, D. to this it as below it. Also, notice that the point in the cepheid. This is the distance to the Large Magel- upper right of this figure will help you obtain the lanic Cloud. Currently, the distance to the LMC proper slope for your line. is believed to be between 57000 and 65000 parsecs. Record your answer in the space pro- vided in Fig. 2. Il. Distance Determination Using the P-L Relation Table III gives data obtained for a cepheid in the Large Magellanic Cloud, a nearby irregu lar galaxy. Column 1 lists the time in fractional days of each observation. The second column gives the apparent magnitude measured at each time. 1. On Fig. 2, plot a light curve for the cepheid data in Table III. Notice that "maximum" refers to maximum brightness. Thus, the magnitude scale seems to be backwards from most other graphs you have seen. 2. Draw a free-hand best-fit curve that represents the data plotted. Make sure that your curve reaches the same maximum and minimum val- ues for each cycle. From the light curve deter- mine the time for each maximum. The differ- ence in time is the pulsation period, P. Record your value of P in the space provided in Fig. 2. 3. Use a calculator to determine the value of log(P), and record the answer in Fig. 1. Look up this value of log(P) on the x-axis of Fig. 1. From the best-fit line determine the cepheid's absolute magnitude. In other words, at your log(P) value