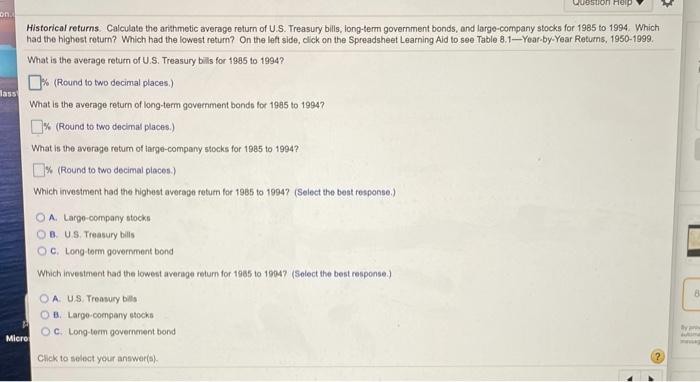
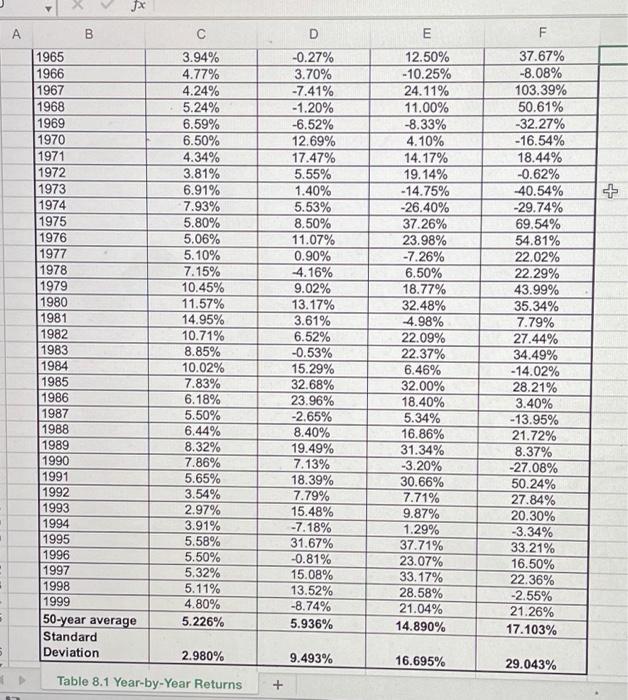
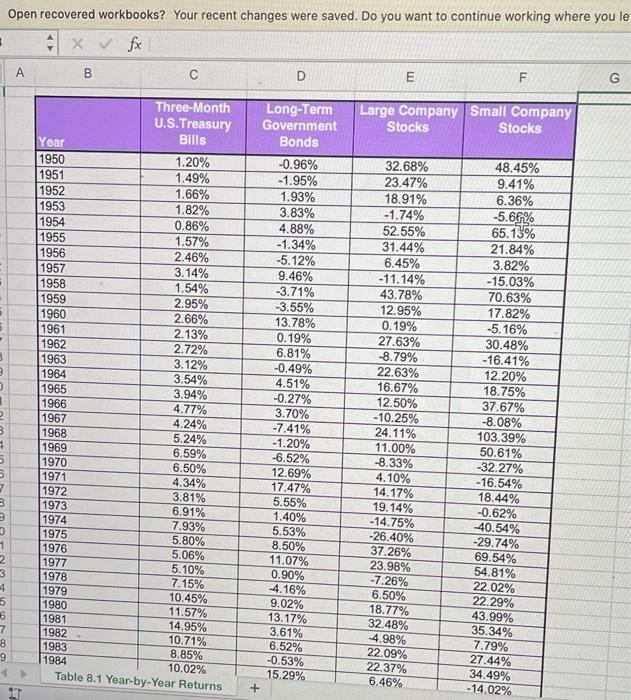
on Hon on lass Historical returns Calculate the arithmetic average return of U.S. Treasury bills, long-term government bonds, and large-company stocks for 1985 to 1994. Which had the highest return? Which had the lowest return? On the left side, click on the Spreadsheet Learning Aid to see Table 8.1-Year-by-Year Returns, 1950-1999. What is the average return of U.S. Treasury bilis for 1985 to 1994? 0% (Round to two decimal places) What is the average return of long-term government bondo for 1945 to 19947 0% (Round to two decimal places.) What is the average ratum of targe-company stocks for 1985 to 1994? % (Round to two decimal places) Which investment had the highest average return for 1985 to 19947 (Select the best rosponse.) O A Large company stocks OB. US Treasury bills OC. Long torm government bond Which Investment had the lowest average return for 1985 to 19047 (Select the best response.) OA US. Tromuy bie OB Large company stocks OC. Long-term government bond Micro Click to select your answer 0 ? X Jx A B D F 1965 1966 1967 1968 1969 1970 1971 1972 1973 1974 1975 1976 1977 1978 1979 1980 1981 1982 1983 1984 1985 1986 1987 1988 1989 1990 1991 1992 1993 1994 1995 1996 1997 1998 1999 50-year average Standard Deviation 3.94% 4.77% 4.24% 5.24% 6.59% 6.50% 4.34% 3.81% 6.91% 7.93% 5.80% 5.06% 5.10% 7.15% 10.45% 11.57% 14.95% 10.71% 8.85% 10.02% 7.83% 6.18% 5.50% 6.44% 8.32% 7.86% 5.65% 3.54% 2.97% 3.91% 5.58% 5.50% 5.32% 5.11% 4.80% 5.226% -0.27% 3.70% -7.41% -1.20% -6.52% 12.69% 17.47% 5.55% 1.40% 5.53% 8.50% 11.07% 0.90% 4.16% 9.02% 13.17% 3.61% 6.52% -0.53% 15.29% 32.68% 23.96% -2.65% 8.40% 19.49% 7.13% 18.39% 7.79% 15.48% -7.18% 31.67% -0.81% 15.08% 13.52% -8.74% 5.936% E 12.50% - 10.25% 24.11% 11.00% -8.33% 4.10% 14.17% 19.14% - 14.75% -26.40% 37.26% 23.98% -7.26% 6.50% 18.77% 32.48% 4.98% 22.09% 22.37% 6.46% 32.00% 18.40% 5.34% 16.86% 31.34% -3.20% 30.66% 7.71% 9.87% 1.29% 37.71% 23.07% 33.17% 28.58% 21.04% 14.890% 37.67% -8.08% 103.39% 50.61% -32.27% -16.54% 18.44% -0.62% 40.54% -29.74% 69.54% 54.81% 22.02% 22.29% 43.99% 35.34% 7.79% 27.44% 34.49% -14.02% 28.21% 3.40% -13.95% 21.72% 8.37% -27.08% 50.24% 27.84% 20.30% -3.34% 33.21% 16.50% 22.36% -2.55% 21.26% 17.103% 2.980% 9.493% 16.695% 29.043% Table 8.1 Year-by-Year Returns + Open recovered workbooks? Your recent changes were saved. Do you want to continue working where you le fox B D E F G Large Company Small Company Stocks Stocks . 5 B Three-Month U.S.Treasury Year Bills 1950 1.20% 1951 1.49% 1952 1.66% 1953 1.82% 1954 0.86% 1955 1.57% 1956 2.46% 1957 3.14% 1958 1.54% 1959 2.95% 1960 2.66% 1961 2.13% 1962 2.72% 1963 3.12% 1964 3.54% 1965 3.94% 1966 4.77% 1967 4.24% 1968 5.24% 1969 6.59% 1970 6.50% 1971 4.34% 1972 3.81% 1973 6.91% 1974 7.93% 1975 5.80% 1976 5.06% 1977 5.10% 1978 7.15% 1979 10.45% 1980 11.57% 1981 14.95% 1982 10.71% 1983 8.85% 10.02% Table 8.1 Year-by-Year Returns 1 Long-Term Government Bonds -0.96% -1.95% 1.93% 3.83% 4.88% -1.34% -5.12% 9.46% -3.71% -3.55% 13.78% 0.19% 6.81% -0.49% 4.51% -0.27% 3.70% -7.41% -1.20% -6.52% 12.69% 17.47% 5.55% 1.40% 5.53% 8.50% 11.07% 0.90% -4.16% 9.02% 13.17% 3.61% 6.52% -0.53% 15.29% + 32.68% 23.47% 18.91% -1.74% 52.55% 31.44% 6.45% -11.14% 43.78% 12.95% 0.19% 27.63% -8.79% 22.63% 16.67% 12.50% -10.25% 24.11% 11.00% -8.33% 4.10% 14.17% 19.14% -14.75% -26.40% 37.26% 23.98% -7.26% 6.50% 18.77% 32.48% 4.98% 22.09% 22.37% 6.46% 8 4 5 3 7 3 48.45% 9.41% 6.36% -5.66% 65.15% 21.84% 3.82% -15.03% 70.63% 17.82% -5.16% 30.48% -16.41% 12.20% 18.75% 37.67% -8.08% 103.39% 50.61% -32.27% -16.54% 18.44% -0.62% -40.54% -29.74% 69.54% 54.81% 22.02% 22.29% 43.99% 35.34% 7.79% 27.44% 34.49% - 14.02% 3 1 2 3 4 5 6 7 8 9 1984