Question
State the main statistical hypotheses (should only be one or two) Identify predictors and outcome variables (have their measurements been clearly explained?) You

• State the main statistical hypotheses (should only be one or two)
• Identify predictors and outcome variables (have their measurements been clearly explained?)
• You may present the above in a table, and the table is excluded from the word count.
• Is the regression model a good approach for the hypotheses stated? Why or why not?
• Assess how the researchers have chosen the predictors in their model.
• Write down the final statistical model using the statistical notation
• Have they conducted a power analysis? What implication does this have for their findings
Assumptions
• Does the researcher state the relevant assumptions and explain how they were assessed and the outcome?
• If there are assumptions that have been violated, does the researcher explain how they dealt with this violation?
• Consider, in general, the implications of having met or violated the assumptions on their research findings.
Presentation of their results
• Assess if and how well they have provided the following information.
• Sociodemographic data/Participant charcterisics
• Univariable regression
• Multivariable regression
• Assess presentation of data in tables and graphs, eg, titles are clear, correct use of decimal places etc.
• Consider the implications to the reader if there are any discrepancies or omissions.
Interpretation of the statistical results
• Is the discussion section linked to the statistical results
• Are the main regression coefficients explained with clear definitions of the units of the covariates?
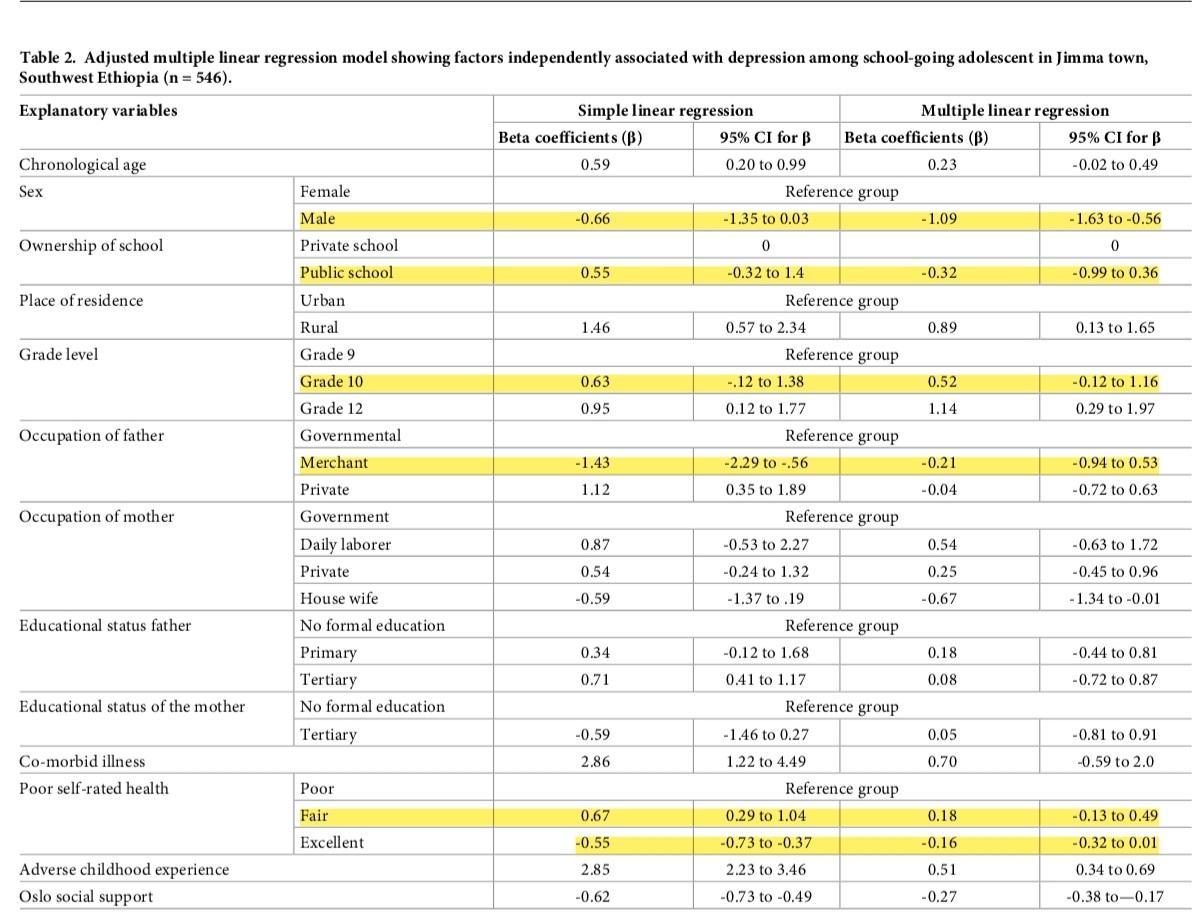
Beta coefficients (B) Female Table 2. Adjusted multiple linear regression model showing factors independently associated with depression among school-going adolescent in Jimma town, Southwest Ethiopia (n = 546). Explanatory variables Chronological age Sex Simple linear regression 95% CI for Multiple linear regression Beta coefficients (B) 95% CI for 0.59 0.20 to 0.99 0.23 -0.02 to 0.49 Reference group Male -0.66 -1.35 to 0.03 -1.09 -1.63 to -0.56 Ownership of school Place of residence Private school 0 Public school 0.55 -0.32 to 1.4 -0.32 0 -0.99 to 0.36 Urban Reference group Rural 1.46 0.57 to 2.34 0.89 0.13 to 1.65 Grade level Grade 9 Reference group Grade 10 0.63 -.12 to 1.38 0.52 -0.12 to 1.16 Grade 12 0.95 0.12 to 1.77 1.14 0.29 to 1.97 Occupation of father Governmental Reference group Merchant -1.43 -2.29 to -.56 -0.21 -0.94 to 0.53 Private 1.12 0.35 to 1.89 -0.04 -0.72 to 0.63 Occupation of mother Government Daily laborer Reference group 0.87 -0.53 to 2.27 0.54 -0.63 to 1.72 Private 0.54 -0.24 to 1.32 0.25 -0.45 to 0.96 House wife -0.59 -1.37 to .19 -0.67 -1.34 to -0.01 Educational status father No formal education Reference group Primary 0.34 -0.12 to 1.68 0.18 -0.44 to 0.81 Tertiary 0.71 0.41 to 1.17 0.08 -0.72 to 0.87 Educational status of the mother No formal education Reference group Tertiary -0.59 -1.46 to 0.27 0.05 -0.81 to 0.91 Co-morbid illness Poor self-rated health 2.86 1.22 to 4.49 0.70 -0.59 to 2.0 Poor Reference group Fair 0.67 0.29 to 1.04 0.18 -0.13 to 0.49 Excellent -0.55 -0.73 to -0.37 -0.16 -0.32 to 0.01 Adverse childhood experience Oslo social support 2.85 2.23 to 3.46 0.51 0.34 to 0.69 -0.62 -0.73 to -0.49 -0.27 -0.38 to-0.17
Step by Step Solution
3.34 Rating (154 Votes )
There are 3 Steps involved in it
Step: 1
Main Statistical Hypotheses Null Hypothesis H0 There is no significant association between the explanatory variables and depression among schoolgoing ...
Get Instant Access to Expert-Tailored Solutions
See step-by-step solutions with expert insights and AI powered tools for academic success
Step: 2

Step: 3

Ace Your Homework with AI
Get the answers you need in no time with our AI-driven, step-by-step assistance
Get Started


