Question: On Matlab: Goal: Making and using functions and input files; plot gridded variables; use embedded control structures. Assignment: You will write an input file, two
On Matlab:

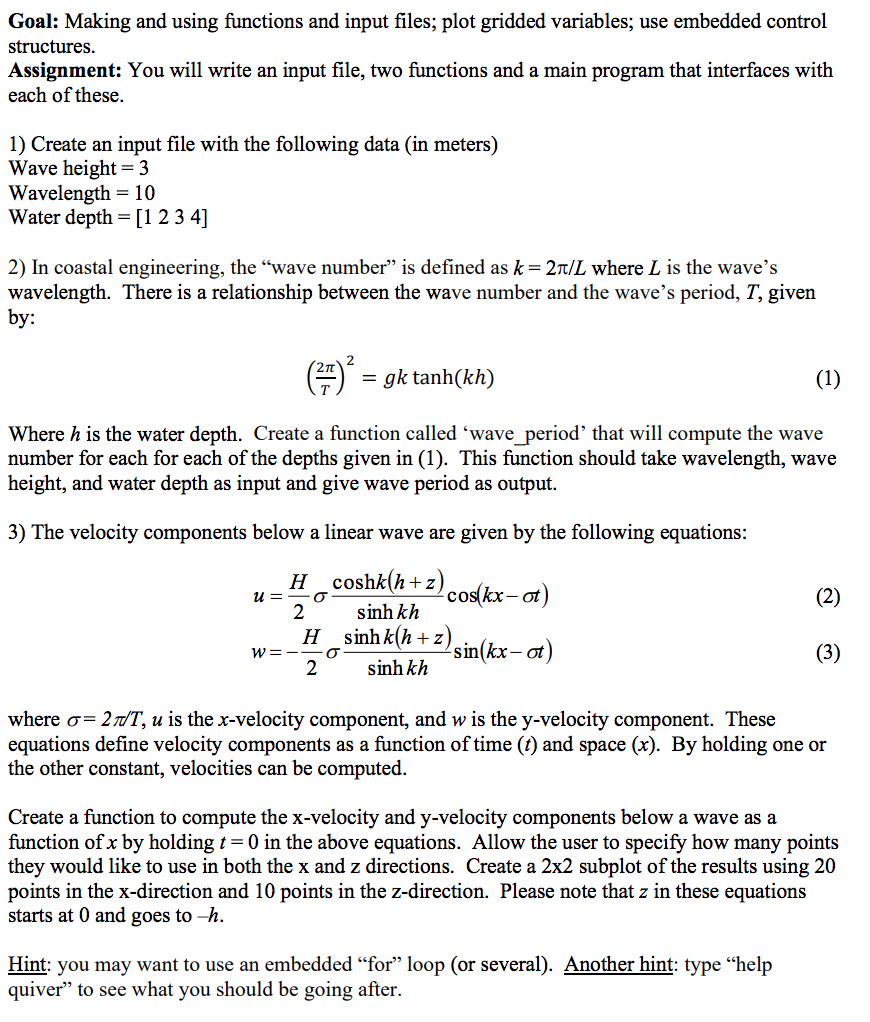
Goal: Making and using functions and input files; plot gridded variables; use embedded control structures. Assignment: You will write an input file, two functions and a main program that interfaces with each of these. 1) Create an input file with the following data (in meters) Wave height = 3 Wavelength = 10 Water depth = [1 2 3 4] 2) In coastal engineering, the "wave number is defined as k=21/L where L is the wave's wavelength. There is a relationship between the wave number and the wave's period, T, given by: () = gk tanh(kh) (1) Where h is the water depth. Create a function called 'wave period' that will compute the wave number for each for each of the depths given in (1). This function should take wavelength, wave height, and water depth as input and give wave period as output. 3) The velocity components below a linear wave are given by the following equations: U= H coshk(h+z) cos(kx-ot) 2 sinh kh 0 (2) Hsinh k(h+z) sin(kx-ot) W= 2 (3) sinh kh where o= 28/T, u is the x-velocity component, and w is the y-velocity component. These equations define velocity components as a function of time (t) and space (x). By holding one or the other constant, velocities can be computed. Create a function to compute the x-velocity and y-velocity components below a wave as a function of x by holding t= 0 in the above equations. Allow the user to specify how many points they would like to use in both the x and z directions. Create a 2x2 subplot of the results using 20 points in the x-direction and 10 points in the z-direction. Please note that z in these equations starts at 0 and goes to -h. Hint: you may want to use an embedded for loop (or several). Another hint: type help quiver" to see what you should be going after. Goal: Making and using functions and input files; plot gridded variables; use embedded control structures. Assignment: You will write an input file, two functions and a main program that interfaces with each of these. 1) Create an input file with the following data (in meters) Wave height = 3 Wavelength = 10 Water depth = [1 2 3 4] 2) In coastal engineering, the "wave number is defined as k=21/L where L is the wave's wavelength. There is a relationship between the wave number and the wave's period, T, given by: () = gk tanh(kh) (1) Where h is the water depth. Create a function called 'wave period' that will compute the wave number for each for each of the depths given in (1). This function should take wavelength, wave height, and water depth as input and give wave period as output. 3) The velocity components below a linear wave are given by the following equations: U= H coshk(h+z) cos(kx-ot) 2 sinh kh 0 (2) Hsinh k(h+z) sin(kx-ot) W= 2 (3) sinh kh where o= 28/T, u is the x-velocity component, and w is the y-velocity component. These equations define velocity components as a function of time (t) and space (x). By holding one or the other constant, velocities can be computed. Create a function to compute the x-velocity and y-velocity components below a wave as a function of x by holding t= 0 in the above equations. Allow the user to specify how many points they would like to use in both the x and z directions. Create a 2x2 subplot of the results using 20 points in the x-direction and 10 points in the z-direction. Please note that z in these equations starts at 0 and goes to -h. Hint: you may want to use an embedded for loop (or several). Another hint: type help quiver" to see what you should be going after
Step by Step Solution
There are 3 Steps involved in it

Get step-by-step solutions from verified subject matter experts


