

Answered step by step
Verified Expert Solution
Question
1 Approved Answer
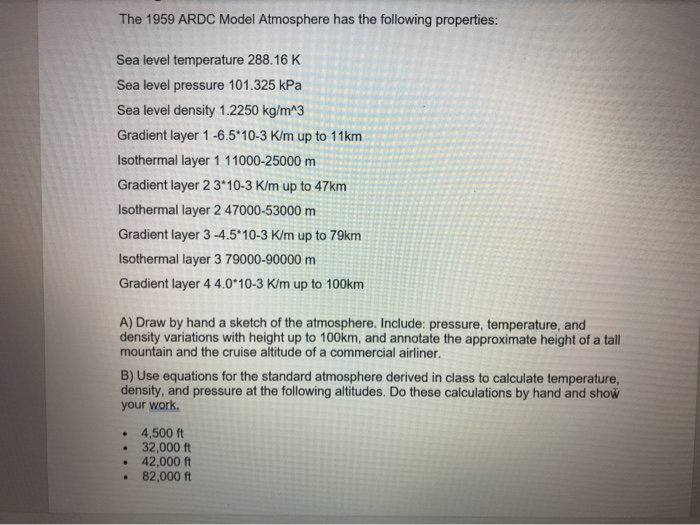
on MATLAB please The 1959 ARDC Model Atmosphere has the following properties: Sea level temperature 288.16 K Sea level pressure 101.325 kPa Sea level density
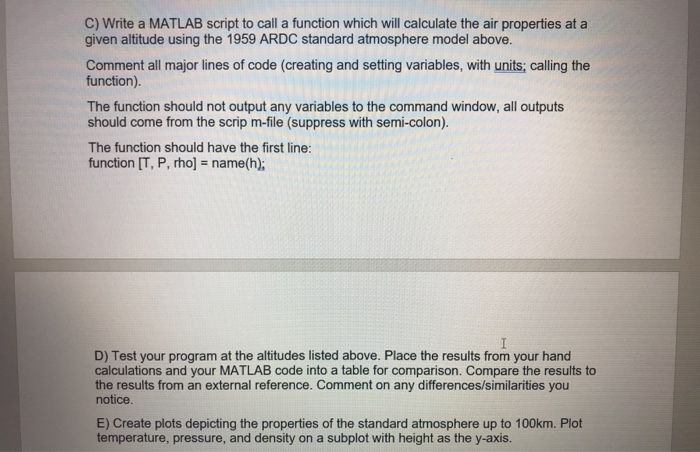
on MATLAB please
Step by Step Solution
There are 3 Steps involved in it
Step: 1

Get Instant Access to Expert-Tailored Solutions
See step-by-step solutions with expert insights and AI powered tools for academic success
Step: 2

Step: 3
Ace Your Homework with AI
Get the answers you need in no time with our AI-driven, step-by-step assistance
Get Started
OpenStack Trove
Authors: Amrith Kumar, Douglas Shelley
1st Edition
1484212215, 9781484212219