On May 15, 2000 you obtain the data on Treasuries from the table below. Compute the semiannual yield curve, spanning over 4 years, from the data using the bootstrap procedure. (3 points)
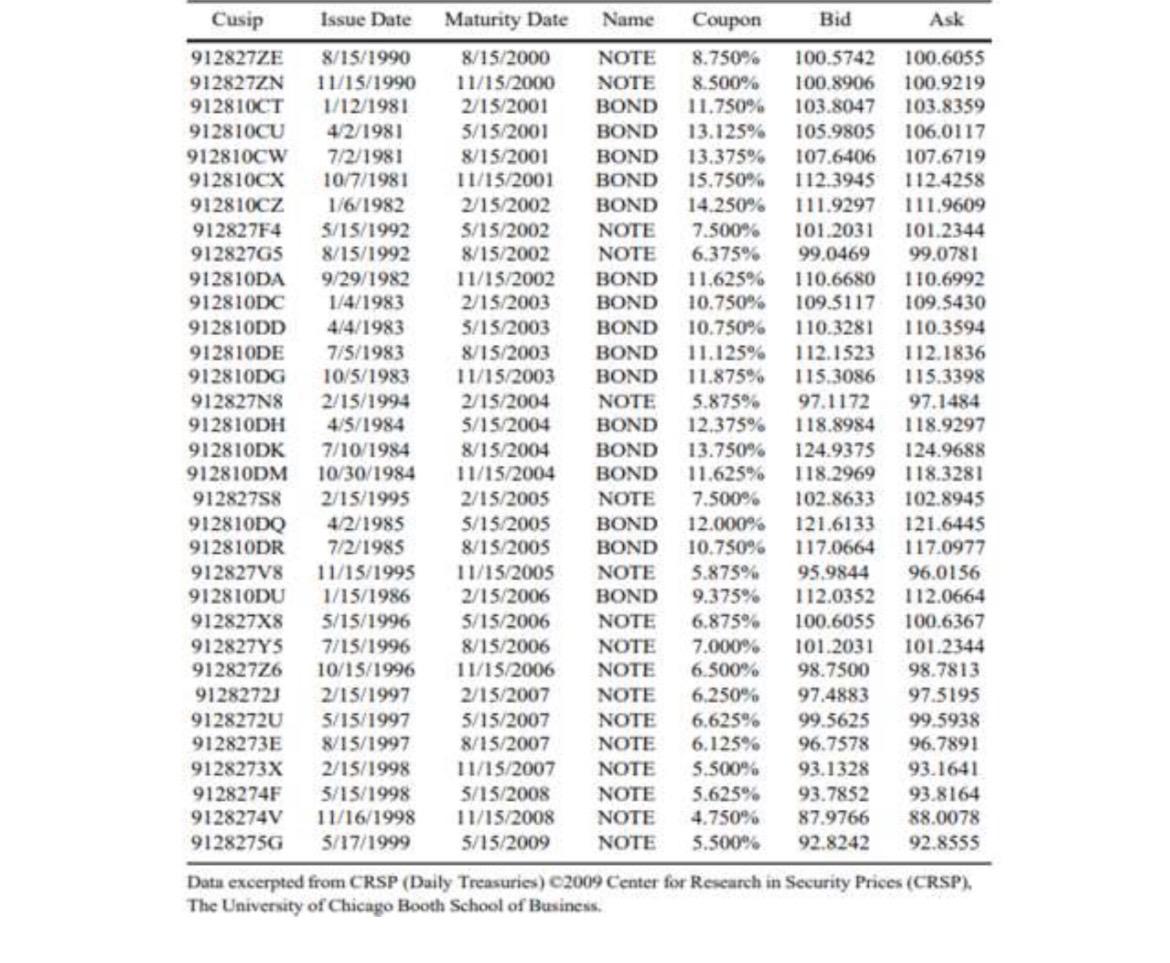 (Hint: For the price of bond, use the average of bid and ask prices.)
Cusip Issue Date Maturity Date Name Coupon Bid Ask 912827ZE 8/15/1990 8/15/2000 NOTE 8.750% 100.5742 100.6055 912827ZN 11/15/1990 11/15/2000 NOTE 8.500% 100.8906 100.9219 912810CT 1/12/1981 2/15/2001 BOND 11.750% 103.8047 103.8339 912810CU 4/2/1981 5/15/2001 BOND 13.125% 105.9805 106.0117 912810CW 7/2/1981 8/15/2001 BOND 13.375% 107.6406 107.6719 912810CX 10/7/1981 11/15/2001 BOND 15.750% 112.3945 112.4238 912810CZ 1/6/1982 2/15/2002 BOND 14.250% 111.9297 111.9609 91282774 5/15/1992 5/15/2002 NOTE 7.500% 101.2031 101.2344 912827GS 8/15/1992 8/15/2002 NOTE 6.375% 99.0469 99.0781 912810DA 9/29/1982 11/15/2002 BOND 11.625% 110.6680 110.6992 912810DC 1/4/1983 2/15/2003 BOND 10.750% 109.5117 109.5430 912810DD 4/4/1983 3/13/2003 BOND 10.730% 110.3281 110.3394 912810DE 7/5/1983 8/15/2003 BOND 11.125% 112.1523 112.1836 912810DG 10/5/1983 11/15/2003 BOND 11.875% 115.3086 115.3398 912827N8 2/15/1994 2/15/2004 NOTE 5.875% 97.1172 97.1484 912810DH 4/5/1984 5/15/2004 BOND 12.375% 118.8984 118.9297 912810DK 7/10/1984 8/15/2004 BOND 13.750% 124.9375 124.9688 912810DM 10/30/1984 11/15/2004 BOND 11.625% 118.2969 118.3281 91282788 2/15/1995 2/15/2005 NOTE 7.500% 102.8633 102.8945 912810DQ 42/1985 5/15/2005 BOND 12.000% 121.6133 121.6445 912810DR 7/2/1985 8/15/2005 BOND 10.750% 117.0664 117.0977 912827V8 11/15/1995 11/15/2005 NOTE 5.875% 95.9844 96.0156 912810DU 1/15/1986 2/15/2006 BOND 9.375% 112.0352 112.0664 912827X8 5/15/1996 5/15/2006 NOTE 6.875% 100.6055 100.6367 912827Y5 7/15/1996 8/15/2006 NOTE 7.000% 101.2031 101.2344 91282776 10/15/1996 11/15/2006 NOTE 6.500% 98.7500 98.7813 91282723 2/15/1997 2/15/2007 NOTE 6,250% 97.4883 97.5195 91282720 5/15/1997 5/15/2007 NOTE 6.625% 99.5625 99.5938 9128273E 8/15/1997 8/15/2007 NOTE 6.125% 96.7578 96.7891 9128273X 2/15/1998 11/15/2007 NOTE 5.500% 93.1328 93.1641 9128274F 3/13/1998 5/15/2008 NOTE 5.625% 93.7852 93.8164 9128274V 11/16/1998 11/15/2008 NOTE 4.750% 87.9766 88.0078 9128275G 5/17/1999 5/15/2009 NOTE 5.500% 92.8242 92.8555 Data excerpted from CRSP (Daily Treasuries) 2009 Center for Research in Security Prices (CRSP). The University of Chicago Booth School of Business Cusip Issue Date Maturity Date Name Coupon Bid Ask 912827ZE 8/15/1990 8/15/2000 NOTE 8.750% 100.5742 100.6055 912827ZN 11/15/1990 11/15/2000 NOTE 8.500% 100.8906 100.9219 912810CT 1/12/1981 2/15/2001 BOND 11.750% 103.8047 103.8339 912810CU 4/2/1981 5/15/2001 BOND 13.125% 105.9805 106.0117 912810CW 7/2/1981 8/15/2001 BOND 13.375% 107.6406 107.6719 912810CX 10/7/1981 11/15/2001 BOND 15.750% 112.3945 112.4238 912810CZ 1/6/1982 2/15/2002 BOND 14.250% 111.9297 111.9609 91282774 5/15/1992 5/15/2002 NOTE 7.500% 101.2031 101.2344 912827GS 8/15/1992 8/15/2002 NOTE 6.375% 99.0469 99.0781 912810DA 9/29/1982 11/15/2002 BOND 11.625% 110.6680 110.6992 912810DC 1/4/1983 2/15/2003 BOND 10.750% 109.5117 109.5430 912810DD 4/4/1983 3/13/2003 BOND 10.730% 110.3281 110.3394 912810DE 7/5/1983 8/15/2003 BOND 11.125% 112.1523 112.1836 912810DG 10/5/1983 11/15/2003 BOND 11.875% 115.3086 115.3398 912827N8 2/15/1994 2/15/2004 NOTE 5.875% 97.1172 97.1484 912810DH 4/5/1984 5/15/2004 BOND 12.375% 118.8984 118.9297 912810DK 7/10/1984 8/15/2004 BOND 13.750% 124.9375 124.9688 912810DM 10/30/1984 11/15/2004 BOND 11.625% 118.2969 118.3281 91282788 2/15/1995 2/15/2005 NOTE 7.500% 102.8633 102.8945 912810DQ 42/1985 5/15/2005 BOND 12.000% 121.6133 121.6445 912810DR 7/2/1985 8/15/2005 BOND 10.750% 117.0664 117.0977 912827V8 11/15/1995 11/15/2005 NOTE 5.875% 95.9844 96.0156 912810DU 1/15/1986 2/15/2006 BOND 9.375% 112.0352 112.0664 912827X8 5/15/1996 5/15/2006 NOTE 6.875% 100.6055 100.6367 912827Y5 7/15/1996 8/15/2006 NOTE 7.000% 101.2031 101.2344 91282776 10/15/1996 11/15/2006 NOTE 6.500% 98.7500 98.7813 91282723 2/15/1997 2/15/2007 NOTE 6,250% 97.4883 97.5195 91282720 5/15/1997 5/15/2007 NOTE 6.625% 99.5625 99.5938 9128273E 8/15/1997 8/15/2007 NOTE 6.125% 96.7578 96.7891 9128273X 2/15/1998 11/15/2007 NOTE 5.500% 93.1328 93.1641 9128274F 3/13/1998 5/15/2008 NOTE 5.625% 93.7852 93.8164 9128274V 11/16/1998 11/15/2008 NOTE 4.750% 87.9766 88.0078 9128275G 5/17/1999 5/15/2009 NOTE 5.500% 92.8242 92.8555 Data excerpted from CRSP (Daily Treasuries) 2009 Center for Research in Security Prices (CRSP). The University of Chicago Booth School of Business