Answered step by step
Verified Expert Solution
Question
1 Approved Answer
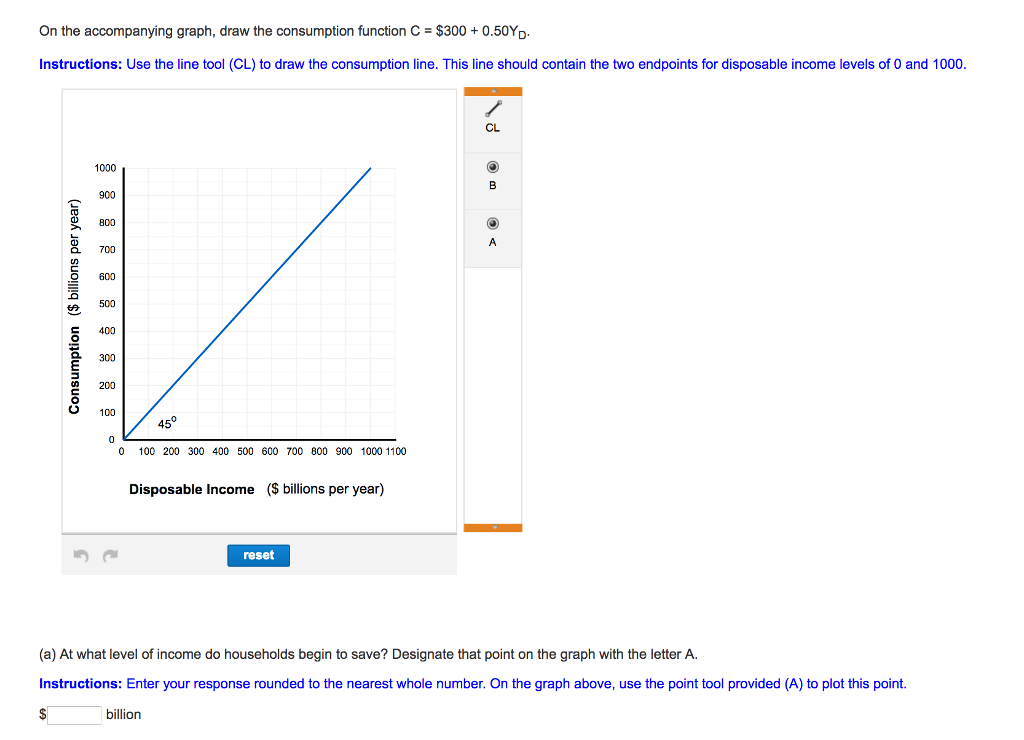
On the accompanying graph, draw the consumption function C = $300 +0.50YD. Instructions: Use the line tool (CL) to draw the consumption line. This


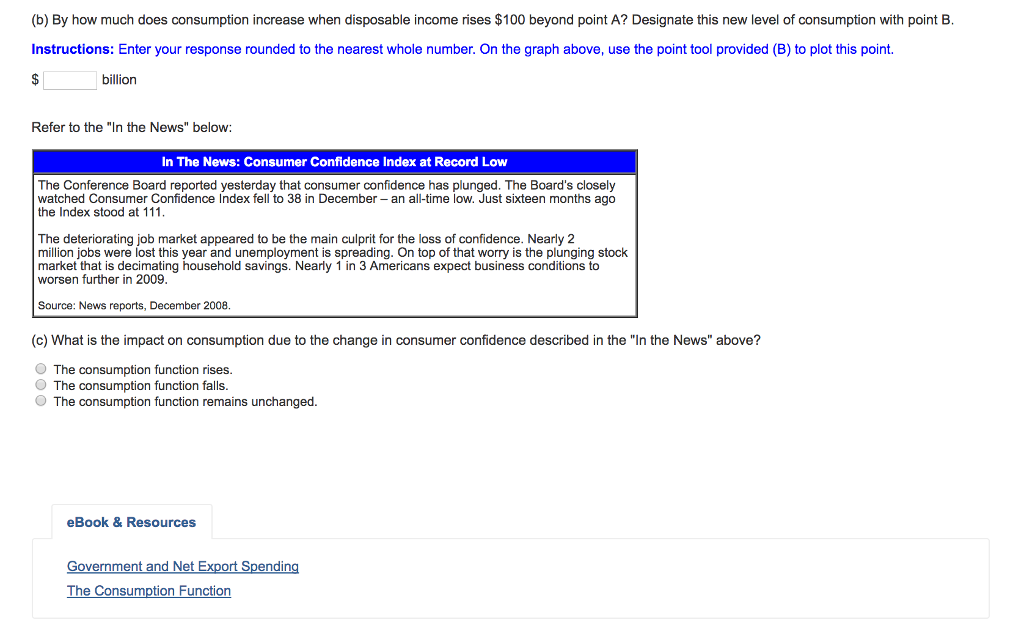
On the accompanying graph, draw the consumption function C = $300 +0.50YD. Instructions: Use the line tool (CL) to draw the consumption line. This line should contain the two endpoints for disposable income levels of 0 and 1000. Consumption ($ billions per year) $ 1000 900 800 700 600 500 400 300 200 100 0 0 45 100 200 300 400 500 600 700 800 900 1000 1100 Disposable Income ($ billions per year) billion reset CL (a) At what level of income do households begin to save? Designate that point on the graph with the letter A. Instructions: Enter your response rounded to the nearest whole number. On the graph above, use the point tool provided (A) to plot this point. A (b) By how much does consumption increase when disposable income rises $100 beyond point A? Designate this new level of consumption with point B. Instructions: Enter your response rounded to the nearest whole number. On the graph above, use the point tool provided (B) to plot this point. $ billion Refer to the "In the News" below: In The News: Consumer Confidence Index at Record Low The Conference Board reported yesterday that consumer confidence has plunged. The Board's closely watched Consumer Confidence Index fell to 38 in December - an all-time low. Just sixteen months ago the Index stood at 111. The deteriorating job market appeared to be the main culprit for the loss of confidence. Nearly 2 million jobs were lost this year and unemployment is spreading. On top of that worry is the plunging stock market that is decimating household savings. Nearly 1 in 3 Americans expect business conditions to worsen further in 2009. Source: News reports, December 2008. (c) What is the impact on consumption due to the change in consumer confidence described in the "In the News" above? The consumption function rises. The consumption function falls. The consumption function remains unchanged. eBook & Resources Government and Net Export Spending The Consumption Function
Step by Step Solution
★★★★★
3.39 Rating (152 Votes )
There are 3 Steps involved in it
Step: 1

Get Instant Access to Expert-Tailored Solutions
See step-by-step solutions with expert insights and AI powered tools for academic success
Step: 2

Step: 3

Ace Your Homework with AI
Get the answers you need in no time with our AI-driven, step-by-step assistance
Get Started


