Question
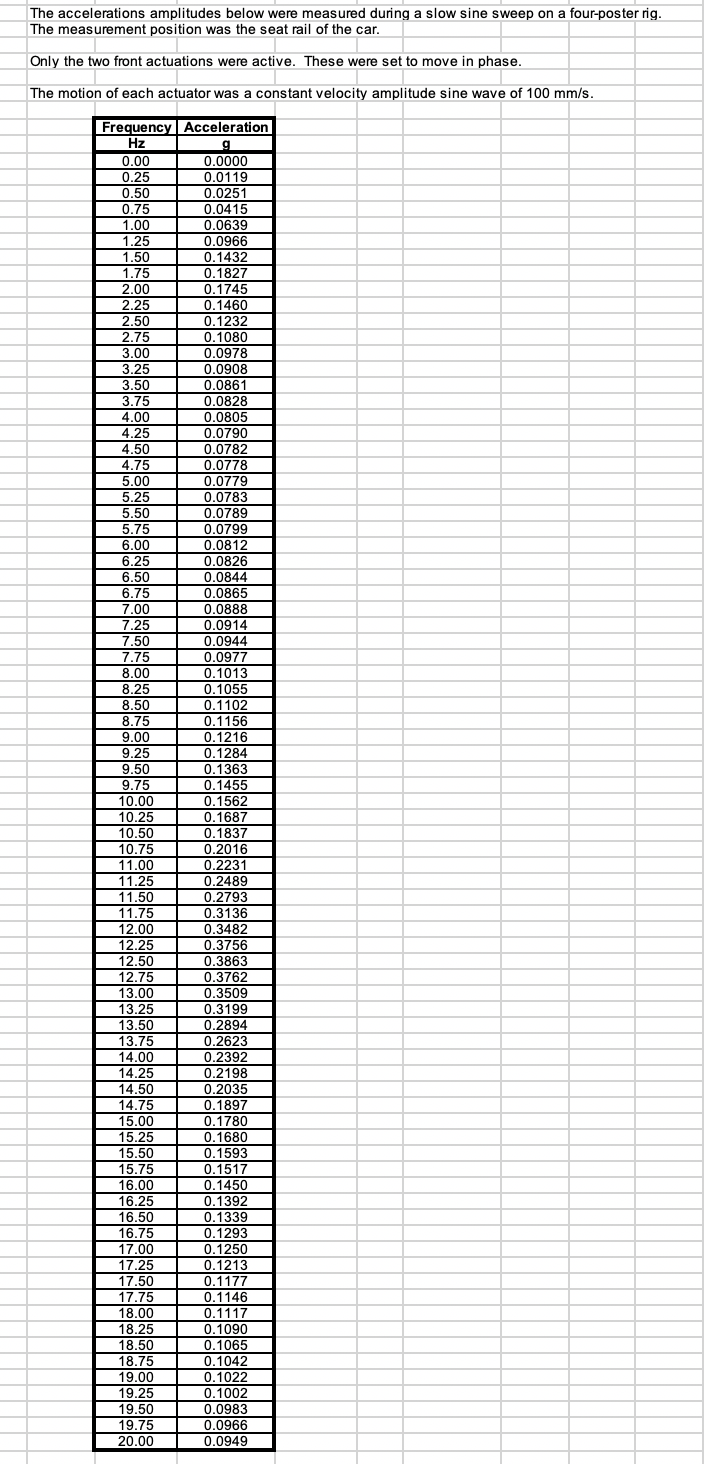
On the Asessments page for the module Moodle site you will find data from a slow sine sweep test conducted on a car on a
On the Asessments page for the module Moodle site you will find data from a slow sine sweep test conducted on a car on a ?four-post? road simulator for the frequency range 0-20 Hz in the EXCEL spreadsheet ?RideComfortData?. The response has been measured vertically on the seat rail of the driver?s seat while the front two actuators moved up and down in phase and the rear actuators remained at rest. The amplitude of the actuator motion was such that the velocity amplitude was constant throughout the frequency sweep at 100 mm/s. The response amplitude at the seat rail is measured in g.
a) Obtain the transmissibility between the input motion of the actuators as a single input and the motion of the seat rail. Provide a graph from EXCEL showing the transmissibility.?
b) The transmissibility in (a) does not tend to 1 at low frequency as might be expected for an ideal one degree of freedom system. Explain this.?
c) Estimate the natural frequency and damping factor for the sprung mass mode involving motion of the body on the front suspension.?
d) If the diameter of the front tyres of the car is 0.6 m estimate the car speed in kph which would cause an ?engine shake? problem in the car.
e) In road tests on a relatively flat test track surface at 60 kph with one front wheel deliberately unbalanced, the idle shake at the seat rail position, measured using an accelerometer, was 2.8 g rms. The other three wheels were in almost perfect balance. What displacement amplitude and frequency of the front two actuators of the road simulator would be necessary to achieve the same seat rail motion in the laboratory? 
The accelerations amplitudes below were measured during a slow sine sweep on a four-poster rig. The measurement position was the seat rail of the car. Only the two front actuations were active. These were set to move in phase. The motion of each actuator was a constant velocity amplitude sine wave of 100 mm/s. Acceleration Frequency Hz g 0.00 0.0000 0.25 0.0119 0.50 0.0251 0.75 0.0415 1.00 0.0639 1.25 0.0966 1.50 0 1432 0.1432 1.75 2.00 2.00 2.25 2.50 2.75 3.00 3.25 3.50 3.75 4.00 4.25 4.50 4.75 7.70 5.00 FOF 5.25 5.50 5.75 9.70 6.00 OF 6.25 0.20 6.50 0:00 6.75 9.70 7.00 ZOF 7.25 1.50 7.50 7.75 1.79 8.00 OF 8.25 0.60 8.50 0:00 8.75 10.10 9.00 OF 9.25 9.60 9.50 2:00 9.75 ere 10.00 10:00 10.25 10.60 10.50 10.75 11.00 11.25 11.50 11.75 12.00 12.00 12.25 12.50 12.75 13.00 13.25 13.50 13.75 14.00 14.00 14. 25 14.25 14.50 14.75 15.00 15.00 15.25 15.50 15.75 16.00 16.00 16.25 16.50 16.75 17.00 17.00 17.25 17.50 17.75 18.00 18.25 10.20 18.50 18.75 10.10 19.00 19.25 19.50 19.75 20.00 01827 0.1827 01745 0.1745 01460 0.1460 0.1232 01080 0.1080 0.0978 0.0908 0.0861 0.0861 0.0828 0.0828 0.0805 0.0790 0.0782 0.0778 00420 0.0779 0.000 0.0783 0.000 0.0789 00700 0:0799 0.0799 0.0812 0.0006 0.0826 0.0844 0.0865 0.0000 0.0888 0.0000 0.0914 0.0914 0.0944 0.0044 0.0977 0.004 0.1013 ACE 0.1055 10.1099 0.1102 10.1102 0.1156 10.1190 0.1216 10.1210 0.1284 01000 0.1363 ACE 0.1455 0.1409 0.1562 0.1687 0.1837 0.2016 0.2231 0.2489 0.2793 0.3136 0.3482 0.3756 0.3863 0.3762 0.3509 0.3199 0 2904 0.2894 0.2623 0.2623 0.2392 0 2392 0.2198 0.2198 0.2035 0 2035 0.1897 0 1780 0.1780 0 1680 0.1680 0 1593 0.1593 0.1517 0 1450 0.1450 0.1392 0.1339 0.1293 0.1250 0.1213 0.1177 0.1146 0.1117 0.1090 0-1000 0.1065 0.1042 0.1022 0.1002 0.0983 0.0966 0.0949
Step by Step Solution
3.40 Rating (166 Votes )
There are 3 Steps involved in it
Step: 1
Certainly lets go through each part of the question step by step a Transmissibility Calculation and Graph Transmissibility TR is the ratio of the outp...
Get Instant Access to Expert-Tailored Solutions
See step-by-step solutions with expert insights and AI powered tools for academic success
Step: 2

Step: 3

Ace Your Homework with AI
Get the answers you need in no time with our AI-driven, step-by-step assistance
Get Started


