Question
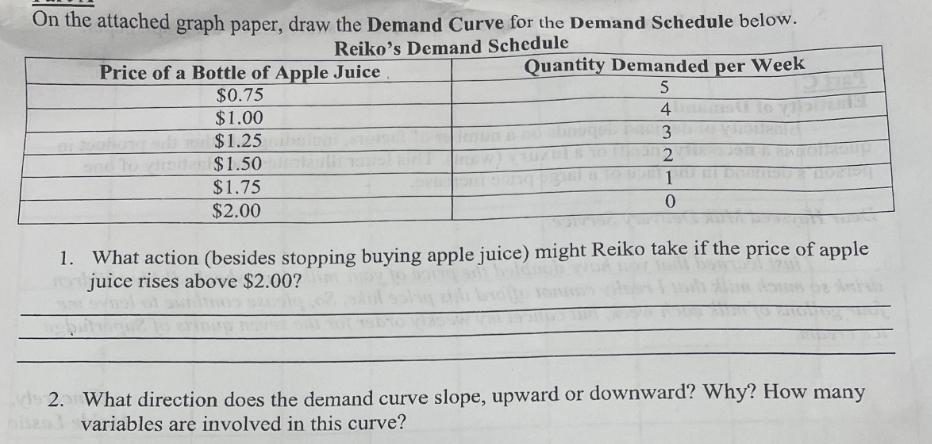
On the attached graph paper, draw the Demand Curve for the Demand Schedule below. Reiko's Demand Schedule Price of a Bottle of Apple Juice

On the attached graph paper, draw the Demand Curve for the Demand Schedule below. Reiko's Demand Schedule Price of a Bottle of Apple Juice $0.75 $1.00 $1.25 $1.50 $1.75 $2.00 Quantity Demanded per Week 5 4 3 2 1 0 56 1. What action (besides stopping buying apple juice) might Reiko take if the price of apple juice rises above $2.00? 2. What direction does the demand curve slope, upward or downward? Why? How many nisend variables are involved in this curve?
Step by Step Solution
3.32 Rating (146 Votes )
There are 3 Steps involved in it
Step: 1
I cant draw on graph paper but I can describe how to draw the demand curve based on the demand sched...
Get Instant Access to Expert-Tailored Solutions
See step-by-step solutions with expert insights and AI powered tools for academic success
Step: 2

Step: 3

Ace Your Homework with AI
Get the answers you need in no time with our AI-driven, step-by-step assistance
Get StartedRecommended Textbook for
Managerial Economics
Authors: Paul Keat, Philip K Young, Steve Erfle
7th edition
0133020266, 978-0133020267
Students also viewed these Economics questions
Question
Answered: 1 week ago
Question
Answered: 1 week ago
Question
Answered: 1 week ago
Question
Answered: 1 week ago
Question
Answered: 1 week ago
Question
Answered: 1 week ago
Question
Answered: 1 week ago
Question
Answered: 1 week ago
Question
Answered: 1 week ago
Question
Answered: 1 week ago
Question
Answered: 1 week ago
Question
Answered: 1 week ago
Question
Answered: 1 week ago
Question
Answered: 1 week ago
Question
Answered: 1 week ago
Question
Answered: 1 week ago
Question
Answered: 1 week ago
Question
Answered: 1 week ago
Question
Answered: 1 week ago
Question
Answered: 1 week ago
Question
Answered: 1 week ago
Question
Answered: 1 week ago
View Answer in SolutionInn App


