Question
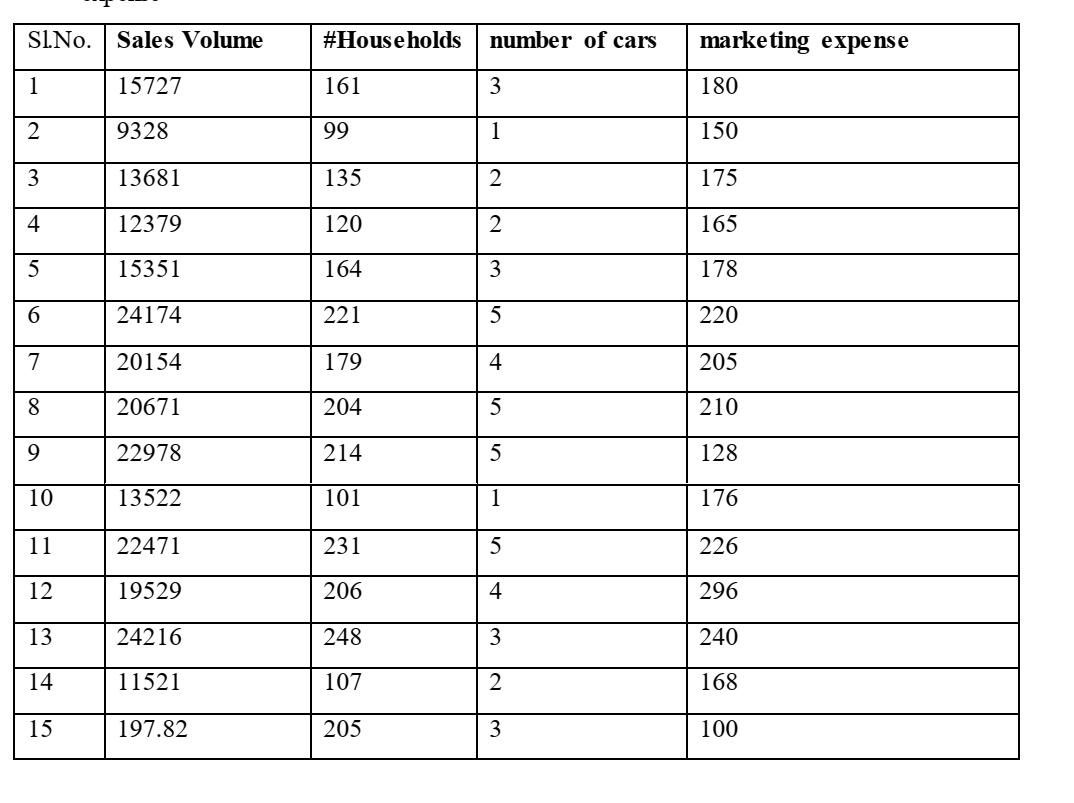
On the basis of the following data, the marketing manager wants to predict the sales volume for the locality on the basis of # households,
On the basis of the following data, the marketing manager wants to predict the sales volume for the locality on the basis of # households, number of cars and marketing expense

i. Draw three scatter plots of sales volume with each of the three variables and comment on their correlation.
ii. Regress the sales volume on #household, number of cars and marketing expenses. Calculate R square and interpret the same.
iii. Determine which variable is/are significant variable/s. Is there any insignificant variable? If yes, regress again, by dropping the variable. Will dropping that variable increases the adjusted R square?
SINO. Sales Volume #Households number of cars marketing expense 1 15727 161 3 180 2 9328 99 1 150 3 13681 135 2 175 4 12379 120 2 165 5 15351 164 3 178 6. 24174 221 220 7 20154 179 4 205 8. 20671 204 210 9. 22978 214 5 128 10 13522 101 1 176 11 22471 231 226 12 19529 206 4 296 13 24216 248 3 240 14 11521 107 168 15 197.82 205 3 100
Step by Step Solution
3.49 Rating (166 Votes )
There are 3 Steps involved in it
Step: 1

Get Instant Access to Expert-Tailored Solutions
See step-by-step solutions with expert insights and AI powered tools for academic success
Step: 2

Step: 3

Ace Your Homework with AI
Get the answers you need in no time with our AI-driven, step-by-step assistance
Get Started


