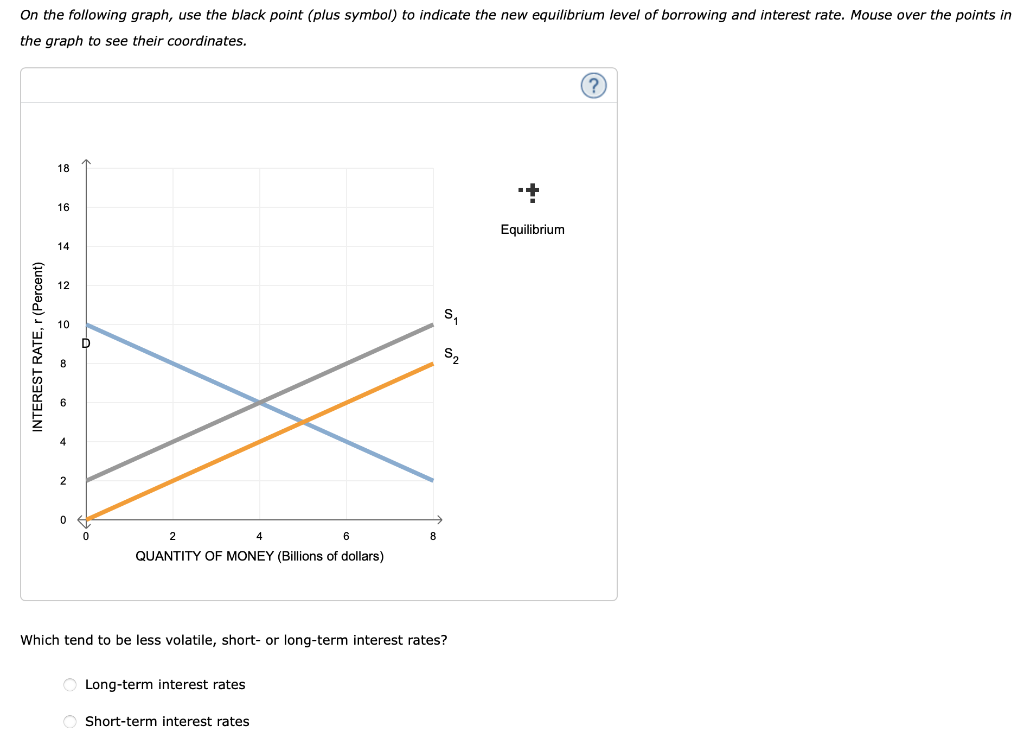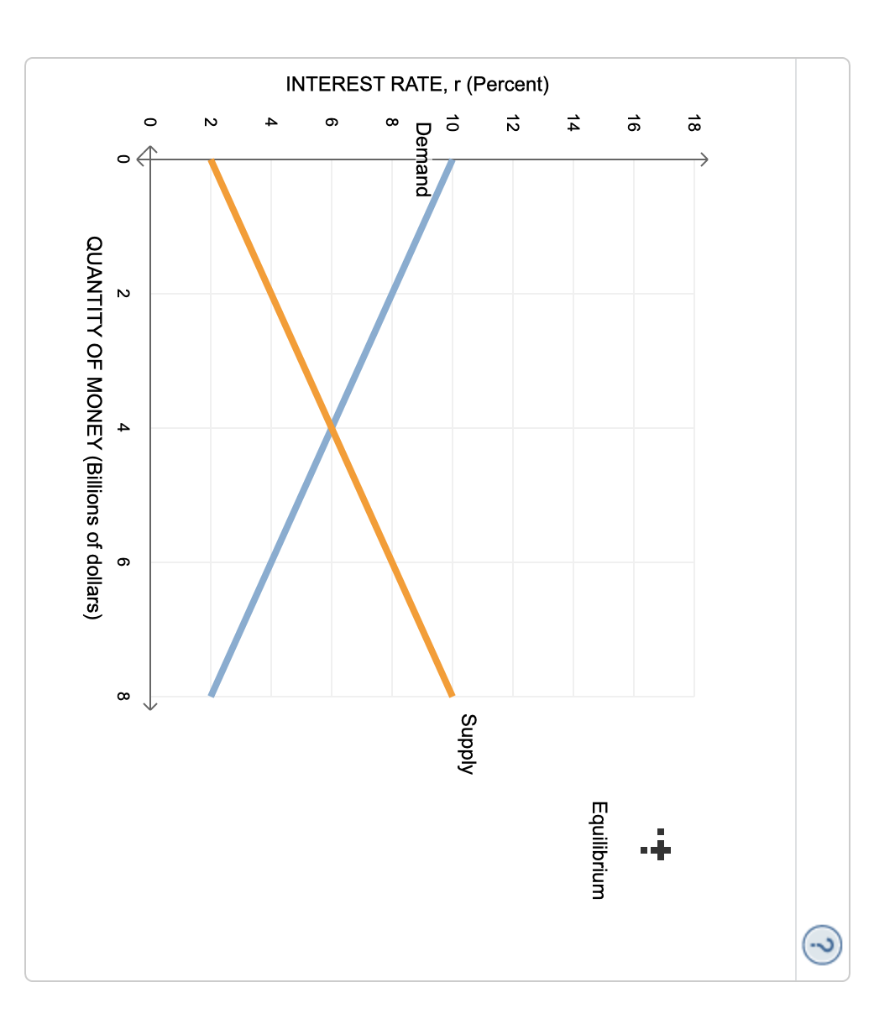


On the following graph, use the black point (plus symbol) to indicate the new equilibrium level of borrowing and interest rate. Mouse over the points in the graph to see their coordinates. INTEREST RATE, r (Percent) 18 16 14 0 0 2 4 6 QUANTITY OF MONEY (Billions of dollars) Long-term interest rates S Which tend to be less volatile, short- or long-term interest rates? Short-term interest rates S + Equilibrium ? If the inflation rate was 2.60% and the nominal interest rate was 8.40% over the last year, what was the real rate of interest over the last year? Disregard cross-product terms; that is, if averaging is required, use the arithmetic average. O 6.67% 7.25% 5.80% 4.93% Firms require capital to invest in productive opportunities. The best firms with the most profitable opportunities can attract capital away from inefficient firms with less profitable opportunities. Investors supply firms with capital at a cost called the interest rate. The interest rate that investors require is determined by several factors, including the availability of production opportunities, the time preference for current consumption, risk, and inflation. The following graph shows the supply of and demand for capital in a market. The upward-sloping supply curve suggests that investors are willing to invest more (delay more current consumption) in exchange for higher interest rates. The downward-sloping demand curve suggests that borrowers of capital (companies) will fund their most profitable opportunities first and their least profitable opportunities later. This fact explains why they are willing to pay a rather high price (interest rate) for capital initially, but also why their appetite for capital decreases over time. On the following graph, use the black point (plus symbol) to indicate the market interest rate. Mouse over the points in the graph to see their coordinates. INTEREST RATE, r (Percent) 18 16 14 12 10 Demand 8 2 0 0 2 4 6 QUANTITY OF MONEY (Billions of dollars) 8 Supply Equilibrium (?) On the following graph, use the black point (plus symbol) to indicate the new equilibrium level of borrowing and interest rate. Mouse over the points in the graph to see their coordinates. INTEREST RATE, r (Percent) 18 16 14 0 0 2 4 6 QUANTITY OF MONEY (Billions of dollars) Long-term interest rates S Which tend to be less volatile, short- or long-term interest rates? Short-term interest rates S + Equilibrium ? If the inflation rate was 2.60% and the nominal interest rate was 8.40% over the last year, what was the real rate of interest over the last year? Disregard cross-product terms; that is, if averaging is required, use the arithmetic average. O 6.67% 7.25% 5.80% 4.93% Firms require capital to invest in productive opportunities. The best firms with the most profitable opportunities can attract capital away from inefficient firms with less profitable opportunities. Investors supply firms with capital at a cost called the interest rate. The interest rate that investors require is determined by several factors, including the availability of production opportunities, the time preference for current consumption, risk, and inflation. The following graph shows the supply of and demand for capital in a market. The upward-sloping supply curve suggests that investors are willing to invest more (delay more current consumption) in exchange for higher interest rates. The downward-sloping demand curve suggests that borrowers of capital (companies) will fund their most profitable opportunities first and their least profitable opportunities later. This fact explains why they are willing to pay a rather high price (interest rate) for capital initially, but also why their appetite for capital decreases over time. On the following graph, use the black point (plus symbol) to indicate the market interest rate. Mouse over the points in the graph to see their coordinates. INTEREST RATE, r (Percent) 18 16 14 12 10 Demand 8 2 0 0 2 4 6 QUANTITY OF MONEY (Billions of dollars) 8 Supply Equilibrium (?)


