

On the left is a graph of the market for soy beans, a perfectly (purely) competitive market.
Question:
On the left is a graph of the market for soy beans, a perfectly (purely) competitive market. On the right is a graph of Roy's Soys, an individual firm in the market for soy beans. The market and the firm are currently in long-run equilibrium at point A. Scroll down to see all of the instructions for both questions.
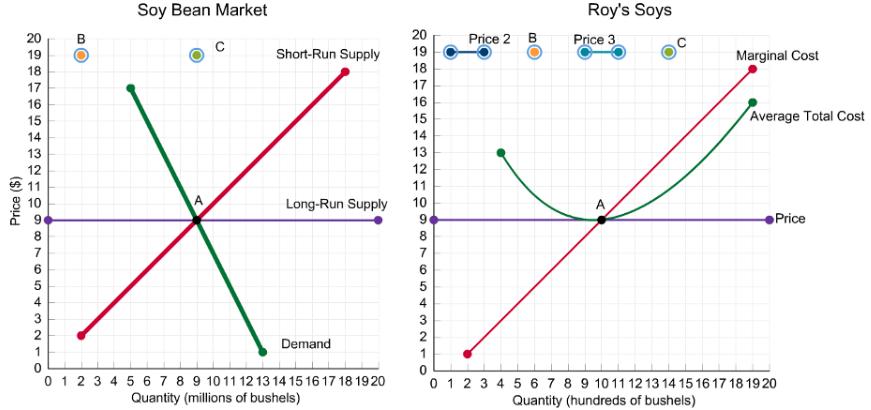
1) Show what happens in the short run on both graphs when a new medical study shows soy beans to be highly carcinogenic. On the market graph, you will shift a curve (or curves). On the firm's graph, use "Price 2" to draw a new price line for the firm. On both graphs, indicate the new equilibrium points with the orange points labeled B.
2) Now, show the changes that get both graphs back to long run equilibrium. Use shift(s) for the market and "Price 3" for the firm. Indicate the new long-run equilibrium with the green points labeled C.
Expert Answer:
The discovery of the medical value of soybeans will result in high demand as more people will start to buy them for weight reduction purposes over and ... View the full answer


