Answered step by step
Verified Expert Solution
Question
1 Approved Answer
*on the question...it has the term used to solve it on the top row (a few examples, average current assetet incomeet loss) and underneath that
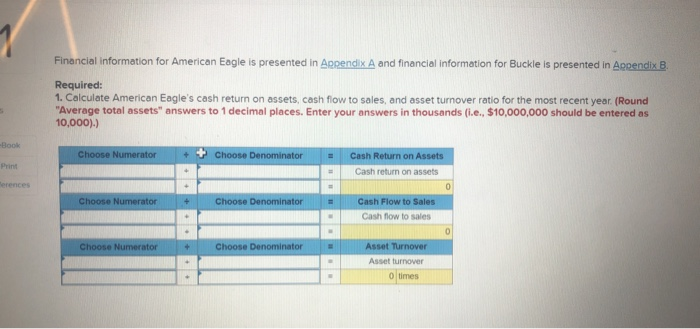
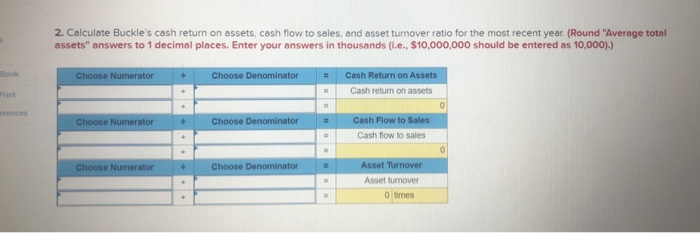
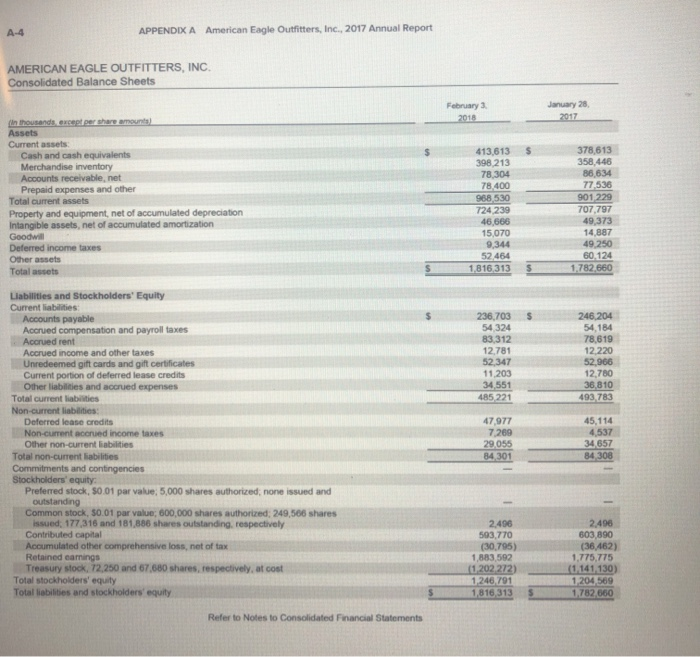
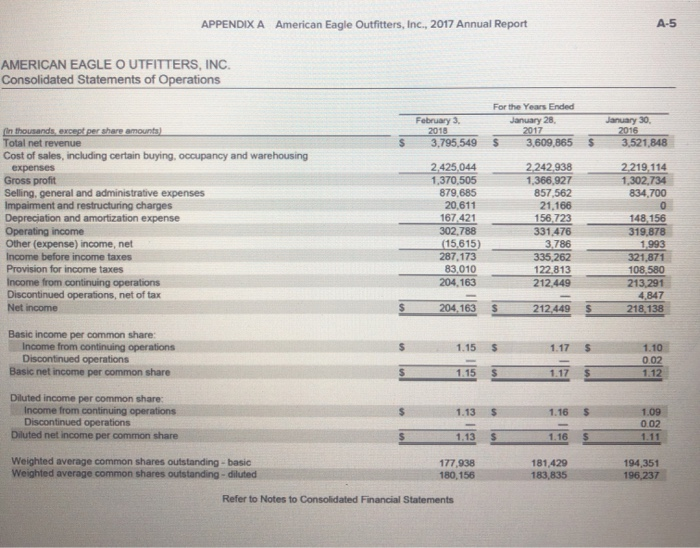
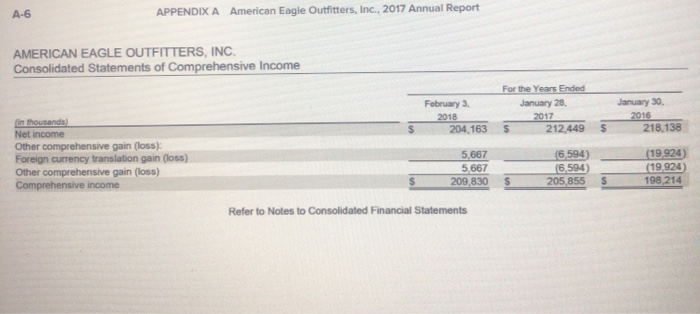
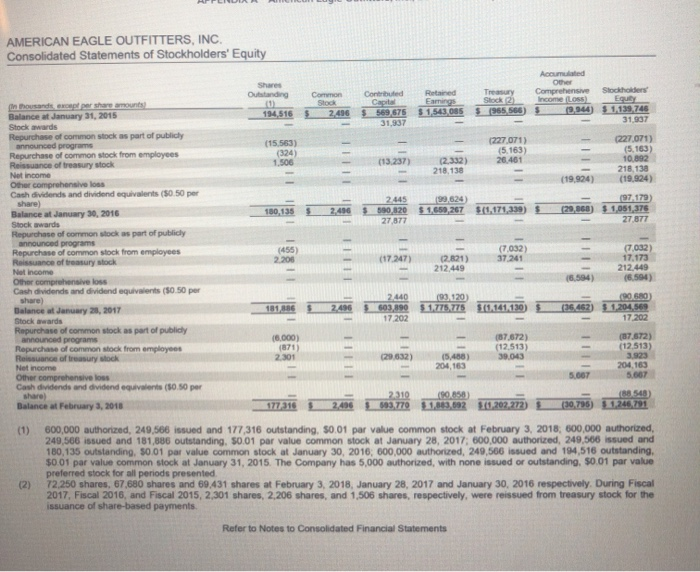
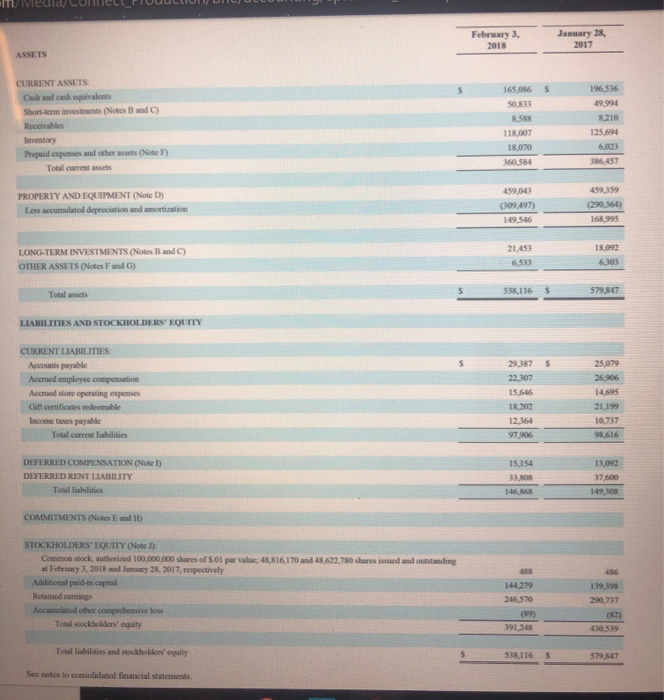
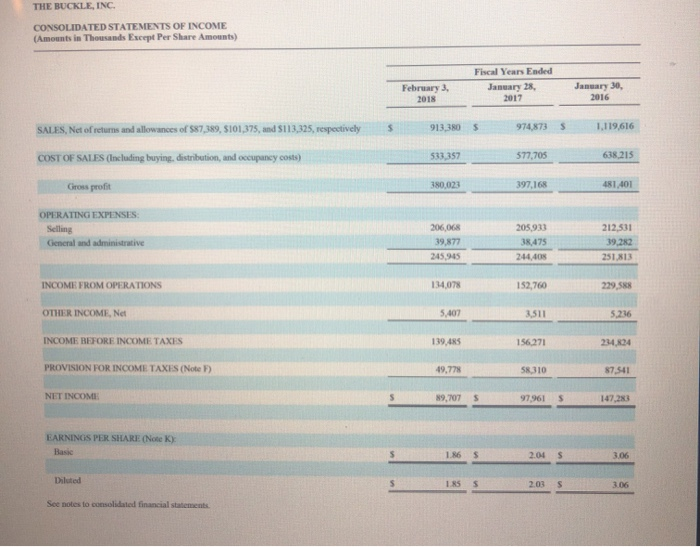
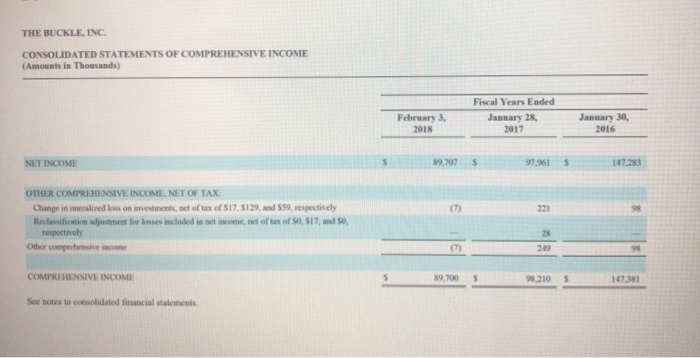 *on the question...it has the term used to solve it on the top row (a few examples, average current assetet incomeet loss) and underneath that it is the actual value. terms: average current assets, Average total assets, financing cash flow, invest in cash flow, net income, net loss, that sales, operating cash flow, total fix assets. Financial information for American Eagle is presented in Appendix A and financial information for Buckle is presented in Appendix B. Required: 1. Calculate American Eagle's cash return on assets, cash flow to sales, and asset turnover ratio for the most recent year. (Round "Average total assets" answers to 1 decimal places. Enter your answers in thousands (ie., $10,000,000 should be entered as 10,000).) -Book Choose Numerator + + Choose Denominator = Cash Return on Assets Cash return on assets Sorences Choose Numerator + Choose Denominator = Cash Flow to Sales Cash flow to sales Choose Numerator + Choose Denominator Asset Turnover Asset turnover O times 2. Calculate Buckle's cash return on assets, cash flow to sales, and asset turnover ratio for the most recent year. (Round "Average total assets" answers to 1 decimal places. Enter your answers in thousands (.e., $10,000,000 should be entered as 10,000).) Book Choose Numerator + Choose Denominator = Cash Return on Assets Cash return on assets erences Choose Numerator + Choose Denominator Cash Flow to Sales Cash flow to sales Choose Numerator + Choose Denominator Asset Turnover Asset turnover O times A-4 APPENDIX A American Eagle Outfitters, Inc., 2017 Annual Report AMERICAN EAGLE OUTFITTERS, INC Consolidated Balance Sheets February 3 2018 January 28 2017 in thousands, exceptpershare amount Assets Current assets Cash and cash equivalents Merchandise inventory Accounts receivable, net Prepaid expenses and other Total current assets Property and equipment, net of accumulated depreciation Intangible assets, net of accumulated amortization Goodwill Deferred income taxes Other assets Total assets 413,613 398 213 78,304 78.400 968,530 724 239 46,666 15.070 9,344 52464 1.816 313 378.613 358 446 86,634 77.536 901 229 707,797 49,373 14,887 49 250 60.124 1,782,660 $ 236,703 54,324 83 312 12.781 52,347 11,203 34 551 485 221 246 204 54,184 78.619 12 220 52,966 12,780 36,810 493 783 Liabilities and Stockholders' Equity Current liabilities: Accounts payable Accrued compensation and payroll taxes Accrued rent Accrued income and other taxes Unredeemed gift cards and gift certificates Current portion of deferred lease credits Other liabilities and accrued expenses Total current liabilities Non-current liabilities: Deferred lease credits Non-current accrued income taxes Other non-current abilities Total non-current liabilities Commitments and contingencies Stockholders' equity: Preferred stock, S0.01 par value: 5,000 shares authorized: none issued and outstanding Common stock, 30.01 par value; 600,000 shares authorized: 249.566 shares issued, 177,316 and 181,886 shares outstanding, respectively Contributed capital Accumulated other comprehensive loss, net of tax Retained camnings Treasury stock, 72.250 and 67.680 shares, respectively, at cost Total stockholders' equity Total liabilities and stockholders' equity 47,977 7269 29,055 84 301 45,114 4,537 34,657 84 308 2.496 593.770 (30,795) 1,883,592 (1 202 272) 1,246,791 1,816,313 2496 603 890 (36.462) 1,775,775 (1 141,130) 1,204,569 1,782,660 Refer to Notes to Consolidated Financial Statements APPENDIX A American Eagle Outfitters, Inc., 2017 Annual Report AMERICAN EAGLE OUTFITTERS, INC. Consolidated Statements of Operations February 3, 2018 3,795,549 For the Year Ended January 28, 2017 $ 3,609,865 January 30, 2016 3,521,848 $ 2.219.114 1,302.734 834,700 in thousands, except per share amounts) Total net revenue Cost of sales, including certain buying, occupancy and warehousing expenses Gross profit Selling, general and administrative expenses Impairment and restructuring charges Depreciation and amortization expense Operating income Other (expense) income, net Income before income taxes Provision for income taxes Income from continuing operations Discontinued operations, net of tax Net income 2.425.044 1.370.505 879,685 20.611 167,421 302.788 (15,615) 287, 173 83 010 204.163 2.242,938 1,366,927 857,562 21,166 156.723 331,476 3.786 335,262 122,813 212.449 148 156 319,878 1993 321,871 108.580 213.291 4,847 218,138 204,163 S 212,449 $ Basic income per common share: Income from continuing operations Discontinued operations Basic net income per common share $ 1.15 1.15 S S 1.17 1.17 1.10 0.02 1.12 $ Diluted income per common share: Income from continuing operations Discontinued operations Diluted net income per common share 1.13 $ 1.16 $ 1.09 0.02 1.13 1.16 Weighted average common shares outstanding - basic Weighted average common shares outstanding-diluted 177,938 180,156 181,429 183,835 194,351 196,237 Refer to Notes to Consolidated Financial Statements A-6 APPENDIX A American Eagle Outfitters, Inc., 2017 Annual Report AMERICAN EAGLE OUTFITTERS, INC. Consolidated Statements of Comprehensive Income February 3 2018 204,163 For the Years Ended January 28, 2017 5 212,449 January 30, 2016 218,138 S in thousands) Net income Other comprehensive gain (loss): Foreign currency translation gain (loss) Other comprehensive gain (loss) Comprehensive income 5,667 5.667 209,830 (6.594) 16594) 205,855 (19.924) 119.924) 198,214 $ S Refer to Notes to Consolidated Financial Statements AMERICAN EAGLE OUTFITTERS, INC. Consolidated Statements of Stockholders' Equity Share Outstanding Contributed Capital $ 569,675 31.937 Retained Earnings $ 1,543.085 Accumulated Other Comprehensive Income (LOS) $ 9,944) Stock 2) 955 566) Stockhoben Equity $ 1,139,746 31,937 $ (155633 (324) 1.506 (227,071) (5.163) 20461 (13.237) (2.332) 218138 (227.071) (5.163) 10.892 218.138 (19.924) (19.924) 2445 590,820 27.877 180.135 $1,650,267 (20.868) $(1,171,339) 197,179) $ 1.051.376 27 877 1455) Thousandexcept per share amounts Balance at January 31, 2015 Stockwards Repurchase of common stock as part of publicly announced programs Repurchase of common stock from employees Reissuance of treasury stock Not Income Other comprehensive loss Cash dividends and dividend equivalents (50.50 per Share) Balance at January 30, 2016 Stockwards Repurchase of common stock as part of publicly announced programs Repurchase of common stock from employees Reissuance of treasury stock Not income Other comprehensive loss Cash dividends and dividend equivalents (50.50 per share) Balance at January 23, 2017 Stockwards Repurchase of common stock as part of publicly announced programs Repurchase of common stock from employees Reissuance of treasury stock Net income Other comprehensive loss Cash dividends and dividend equivalents (50.50 per share) Balance at February 3, 2018 (7.032) 37 241 (17.247) (2.821) 212.449 (7032) 17.173 212.449 (6504) (6.594) 2440 603,890 17.202 (93.120) $1775,775 $11.141.130) (36.462) $ 1.204.569 17.202 16.000) 11 (7 672) (12.513) 39.043 (29.632) (5,488) 204,163 (87.672) (12.513) 31923 204,163 5.667 (8158) 177.310 2,496 693,770 1,149,092 30.202.272) E (30,786) 31,246,721 (1) 600,000 authorized, 249,506 issued and 177,316 outstanding, 30.01 par value common stock at February 3, 2018, 800,000 authorized 249,506 issued and 181,886 outstanding, 50.01 par value common stock at January 28, 2017, 600,000 authorized, 249,506 issued and 180,135 outstanding, 30.01 par value common stock at January 30, 2016; 600,000 authorized, 249,566 issued and 194,516 outstanding. $0.01 par value common stock at January 31, 2015. The Company has 5,000 authorized, with none issued or outstanding, $0.01 par value preferred stock for all periods presented 72. 250 shares, 67,680 shares and 69.431 shares at February 3, 2018. January 28, 2017 and January 30, 2016 respectively. During Fiscal 2017, Fiscal 2016, and Fiscal 2015, 2.301 shares, 2,206 shares, and 1.506 shares, respectively, were reissued from treasury stock for the issuance of share-based payments. Refer to Notes to Consolidated Financial Statements mveula/Coll_PIUUULLIUM DICULUM January 28, February 3 2018 2017 ASSETS 165 ON S SOR 8588 CURRENT ASSETS Chad cash equivalents Short-term investments (Notes Band) Receivables Inventory Prepaid expenses and other assets (Note F) Total current assets 196,536 49.994 8.210 125 694 6,023 118007 18.070 30.584 386 457 459.03 PROPERTY AND EQUIPMENT (Note D) Less accumulated depreciation and amortization 309,497) 149.546 459.359 (290,364) 168995 LONG-TERM INVESTMENTS (Notes Band) OTHER ASSETS (Notes and G) 21.453 6533 18.092 6.103 538,116 Total assets 579,817 LIABILITIES AND STOCKHOLDERS' EQUITY CURRENT LIABILITIES: Accounts payable Accrued employee compensation Accued store operating expenses Gift certificates redeemable Income taxes payable Total current liabilities 29,3875 22,307 15.646 1R 202 25,079 26 906 14 695 21,199 10,737 12-164 97,906 98 616 15.154 DEFERRED COMPENSATION (Note 1) DEFERRED RENT LIABILITY Total liabilities 13,092 37600 14910 COMMITMENTS (Notes and 11) STOCKHOLDERS' EQUITY (Note J} Common stock, authorized 100,000,000 shares of S.ol por value, 1816,170 and 48,622,780 shares issued and outstanding at Feleuary 3, 2018 and January 28, 2017, respectively Additional paid-in capital Retained carings Accumulated other comprehensive loss Tocal stockholders' equity 139,398 144.279 206 570 220,737 (29) 391.248 30,539 Total liabilities and stockholders' equity SEX 116 Scenoles to consolidated financial statements THE BUCKLE, INC. CONSOLIDATED STATEMENTS OF INCOME (Amounts in Thousands Except Per Share Amounts) Fiscal Year Ended February 2018 January 28 2017 January 30, 2016 SALES, Net of returns and allowances of $87,389, 5101,375, and $113,325, respectively 913,380 $ 974,873 $ 1.119,616 COST OF SALES (Including buying, distribution, and occupancy costs) 533.357 577,705 638.215 Gross profit 380.023 397,168 481,401 OPERATING EXPENSES: 206,068 39,877 245.95 205.933 38475 212,531 3922 General and administrative 244.40 251 13 INCOME FROM OPERATIONS 134,078 152,760 229.588 OTHER INCOME, Net 5.301 511 5.216 INCOME BEFORE INCOME TAXES 139,485 156.271 234,824 PROVISION FOR INCOME TAXES (Note F) 49,778 SR 110 NET INCOME 97,9615 147 23 EARNINGS PER SHARE (Note ) Basic 2.04 Diluted See notes to consolidated financial statements THE BUCKLE, INC. CONSOLIDATED STATEMENTS OF COMPREHENSIVE INCOME (Amounts in Thousands) Fiscal Year Ended February 3, 30, January 28, 2017 Jan 2016 2018 NET INCOME 89,707 $ 97.961 S . 147283 OTHER COMPREHENSIVE INCOME, NET OF TAX: Change in realized os on investments, net of tax of S17, 5129, and 599, respectively Reclassification adjustment for losses included in net income, net of tax of S0, S17, and so respectively Other comprehensive income COMPREHENSIVE INCOME 9210 16.15 See notes to consolidated financial statements Financial information for American Eagle is presented in Appendix A and financial information for Buckle is presented in Appendix B. Required: 1. Calculate American Eagle's cash return on assets, cash flow to sales, and asset turnover ratio for the most recent year. (Round "Average total assets" answers to 1 decimal places. Enter your answers in thousands (ie., $10,000,000 should be entered as 10,000).) -Book Choose Numerator + + Choose Denominator = Cash Return on Assets Cash return on assets Sorences Choose Numerator + Choose Denominator = Cash Flow to Sales Cash flow to sales Choose Numerator + Choose Denominator Asset Turnover Asset turnover O times 2. Calculate Buckle's cash return on assets, cash flow to sales, and asset turnover ratio for the most recent year. (Round "Average total assets" answers to 1 decimal places. Enter your answers in thousands (.e., $10,000,000 should be entered as 10,000).) Book Choose Numerator + Choose Denominator = Cash Return on Assets Cash return on assets erences Choose Numerator + Choose Denominator Cash Flow to Sales Cash flow to sales Choose Numerator + Choose Denominator Asset Turnover Asset turnover O times A-4 APPENDIX A American Eagle Outfitters, Inc., 2017 Annual Report AMERICAN EAGLE OUTFITTERS, INC Consolidated Balance Sheets February 3 2018 January 28 2017 in thousands, exceptpershare amount Assets Current assets Cash and cash equivalents Merchandise inventory Accounts receivable, net Prepaid expenses and other Total current assets Property and equipment, net of accumulated depreciation Intangible assets, net of accumulated amortization Goodwill Deferred income taxes Other assets Total assets 413,613 398 213 78,304 78.400 968,530 724 239 46,666 15.070 9,344 52464 1.816 313 378.613 358 446 86,634 77.536 901 229 707,797 49,373 14,887 49 250 60.124 1,782,660 $ 236,703 54,324 83 312 12.781 52,347 11,203 34 551 485 221 246 204 54,184 78.619 12 220 52,966 12,780 36,810 493 783 Liabilities and Stockholders' Equity Current liabilities: Accounts payable Accrued compensation and payroll taxes Accrued rent Accrued income and other taxes Unredeemed gift cards and gift certificates Current portion of deferred lease credits Other liabilities and accrued expenses Total current liabilities Non-current liabilities: Deferred lease credits Non-current accrued income taxes Other non-current abilities Total non-current liabilities Commitments and contingencies Stockholders' equity: Preferred stock, S0.01 par value: 5,000 shares authorized: none issued and outstanding Common stock, 30.01 par value; 600,000 shares authorized: 249.566 shares issued, 177,316 and 181,886 shares outstanding, respectively Contributed capital Accumulated other comprehensive loss, net of tax Retained camnings Treasury stock, 72.250 and 67.680 shares, respectively, at cost Total stockholders' equity Total liabilities and stockholders' equity 47,977 7269 29,055 84 301 45,114 4,537 34,657 84 308 2.496 593.770 (30,795) 1,883,592 (1 202 272) 1,246,791 1,816,313 2496 603 890 (36.462) 1,775,775 (1 141,130) 1,204,569 1,782,660 Refer to Notes to Consolidated Financial Statements APPENDIX A American Eagle Outfitters, Inc., 2017 Annual Report AMERICAN EAGLE OUTFITTERS, INC. Consolidated Statements of Operations February 3, 2018 3,795,549 For the Year Ended January 28, 2017 $ 3,609,865 January 30, 2016 3,521,848 $ 2.219.114 1,302.734 834,700 in thousands, except per share amounts) Total net revenue Cost of sales, including certain buying, occupancy and warehousing expenses Gross profit Selling, general and administrative expenses Impairment and restructuring charges Depreciation and amortization expense Operating income Other (expense) income, net Income before income taxes Provision for income taxes Income from continuing operations Discontinued operations, net of tax Net income 2.425.044 1.370.505 879,685 20.611 167,421 302.788 (15,615) 287, 173 83 010 204.163 2.242,938 1,366,927 857,562 21,166 156.723 331,476 3.786 335,262 122,813 212.449 148 156 319,878 1993 321,871 108.580 213.291 4,847 218,138 204,163 S 212,449 $ Basic income per common share: Income from continuing operations Discontinued operations Basic net income per common share $ 1.15 1.15 S S 1.17 1.17 1.10 0.02 1.12 $ Diluted income per common share: Income from continuing operations Discontinued operations Diluted net income per common share 1.13 $ 1.16 $ 1.09 0.02 1.13 1.16 Weighted average common shares outstanding - basic Weighted average common shares outstanding-diluted 177,938 180,156 181,429 183,835 194,351 196,237 Refer to Notes to Consolidated Financial Statements A-6 APPENDIX A American Eagle Outfitters, Inc., 2017 Annual Report AMERICAN EAGLE OUTFITTERS, INC. Consolidated Statements of Comprehensive Income February 3 2018 204,163 For the Years Ended January 28, 2017 5 212,449 January 30, 2016 218,138 S in thousands) Net income Other comprehensive gain (loss): Foreign currency translation gain (loss) Other comprehensive gain (loss) Comprehensive income 5,667 5.667 209,830 (6.594) 16594) 205,855 (19.924) 119.924) 198,214 $ S Refer to Notes to Consolidated Financial Statements AMERICAN EAGLE OUTFITTERS, INC. Consolidated Statements of Stockholders' Equity Share Outstanding Contributed Capital $ 569,675 31.937 Retained Earnings $ 1,543.085 Accumulated Other Comprehensive Income (LOS) $ 9,944) Stock 2) 955 566) Stockhoben Equity $ 1,139,746 31,937 $ (155633 (324) 1.506 (227,071) (5.163) 20461 (13.237) (2.332) 218138 (227.071) (5.163) 10.892 218.138 (19.924) (19.924) 2445 590,820 27.877 180.135 $1,650,267 (20.868) $(1,171,339) 197,179) $ 1.051.376 27 877 1455) Thousandexcept per share amounts Balance at January 31, 2015 Stockwards Repurchase of common stock as part of publicly announced programs Repurchase of common stock from employees Reissuance of treasury stock Not Income Other comprehensive loss Cash dividends and dividend equivalents (50.50 per Share) Balance at January 30, 2016 Stockwards Repurchase of common stock as part of publicly announced programs Repurchase of common stock from employees Reissuance of treasury stock Not income Other comprehensive loss Cash dividends and dividend equivalents (50.50 per share) Balance at January 23, 2017 Stockwards Repurchase of common stock as part of publicly announced programs Repurchase of common stock from employees Reissuance of treasury stock Net income Other comprehensive loss Cash dividends and dividend equivalents (50.50 per share) Balance at February 3, 2018 (7.032) 37 241 (17.247) (2.821) 212.449 (7032) 17.173 212.449 (6504) (6.594) 2440 603,890 17.202 (93.120) $1775,775 $11.141.130) (36.462) $ 1.204.569 17.202 16.000) 11 (7 672) (12.513) 39.043 (29.632) (5,488) 204,163 (87.672) (12.513) 31923 204,163 5.667 (8158) 177.310 2,496 693,770 1,149,092 30.202.272) E (30,786) 31,246,721 (1) 600,000 authorized, 249,506 issued and 177,316 outstanding, 30.01 par value common stock at February 3, 2018, 800,000 authorized 249,506 issued and 181,886 outstanding, 50.01 par value common stock at January 28, 2017, 600,000 authorized, 249,506 issued and 180,135 outstanding, 30.01 par value common stock at January 30, 2016; 600,000 authorized, 249,566 issued and 194,516 outstanding. $0.01 par value common stock at January 31, 2015. The Company has 5,000 authorized, with none issued or outstanding, $0.01 par value preferred stock for all periods presented 72. 250 shares, 67,680 shares and 69.431 shares at February 3, 2018. January 28, 2017 and January 30, 2016 respectively. During Fiscal 2017, Fiscal 2016, and Fiscal 2015, 2.301 shares, 2,206 shares, and 1.506 shares, respectively, were reissued from treasury stock for the issuance of share-based payments. Refer to Notes to Consolidated Financial Statements mveula/Coll_PIUUULLIUM DICULUM January 28, February 3 2018 2017 ASSETS 165 ON S SOR 8588 CURRENT ASSETS Chad cash equivalents Short-term investments (Notes Band) Receivables Inventory Prepaid expenses and other assets (Note F) Total current assets 196,536 49.994 8.210 125 694 6,023 118007 18.070 30.584 386 457 459.03 PROPERTY AND EQUIPMENT (Note D) Less accumulated depreciation and amortization 309,497) 149.546 459.359 (290,364) 168995 LONG-TERM INVESTMENTS (Notes Band) OTHER ASSETS (Notes and G) 21.453 6533 18.092 6.103 538,116 Total assets 579,817 LIABILITIES AND STOCKHOLDERS' EQUITY CURRENT LIABILITIES: Accounts payable Accrued employee compensation Accued store operating expenses Gift certificates redeemable Income taxes payable Total current liabilities 29,3875 22,307 15.646 1R 202 25,079 26 906 14 695 21,199 10,737 12-164 97,906 98 616 15.154 DEFERRED COMPENSATION (Note 1) DEFERRED RENT LIABILITY Total liabilities 13,092 37600 14910 COMMITMENTS (Notes and 11) STOCKHOLDERS' EQUITY (Note J} Common stock, authorized 100,000,000 shares of S.ol por value, 1816,170 and 48,622,780 shares issued and outstanding at Feleuary 3, 2018 and January 28, 2017, respectively Additional paid-in capital Retained carings Accumulated other comprehensive loss Tocal stockholders' equity 139,398 144.279 206 570 220,737 (29) 391.248 30,539 Total liabilities and stockholders' equity SEX 116 Scenoles to consolidated financial statements THE BUCKLE, INC. CONSOLIDATED STATEMENTS OF INCOME (Amounts in Thousands Except Per Share Amounts) Fiscal Year Ended February 2018 January 28 2017 January 30, 2016 SALES, Net of returns and allowances of $87,389, 5101,375, and $113,325, respectively 913,380 $ 974,873 $ 1.119,616 COST OF SALES (Including buying, distribution, and occupancy costs) 533.357 577,705 638.215 Gross profit 380.023 397,168 481,401 OPERATING EXPENSES: 206,068 39,877 245.95 205.933 38475 212,531 3922 General and administrative 244.40 251 13 INCOME FROM OPERATIONS 134,078 152,760 229.588 OTHER INCOME, Net 5.301 511 5.216 INCOME BEFORE INCOME TAXES 139,485 156.271 234,824 PROVISION FOR INCOME TAXES (Note F) 49,778 SR 110 NET INCOME 97,9615 147 23 EARNINGS PER SHARE (Note ) Basic 2.04 Diluted See notes to consolidated financial statements THE BUCKLE, INC. CONSOLIDATED STATEMENTS OF COMPREHENSIVE INCOME (Amounts in Thousands) Fiscal Year Ended February 3, 30, January 28, 2017 Jan 2016 2018 NET INCOME 89,707 $ 97.961 S . 147283 OTHER COMPREHENSIVE INCOME, NET OF TAX: Change in realized os on investments, net of tax of S17, 5129, and 599, respectively Reclassification adjustment for losses included in net income, net of tax of S0, S17, and so respectively Other comprehensive income COMPREHENSIVE INCOME 9210 16.15 See notes to consolidated financial statements
*on the question...it has the term used to solve it on the top row (a few examples, average current assetet incomeet loss) and underneath that it is the actual value.
average current assets, Average total assets, financing cash flow, invest in cash flow, net income, net loss, that sales, operating cash flow, total fix assets.
Step by Step Solution
There are 3 Steps involved in it
Step: 1

Get Instant Access to Expert-Tailored Solutions
See step-by-step solutions with expert insights and AI powered tools for academic success
Step: 2

Step: 3
Ace Your Homework with AI
Get the answers you need in no time with our AI-driven, step-by-step assistance
Get Started