Answered step by step
Verified Expert Solution
Question
1 Approved Answer
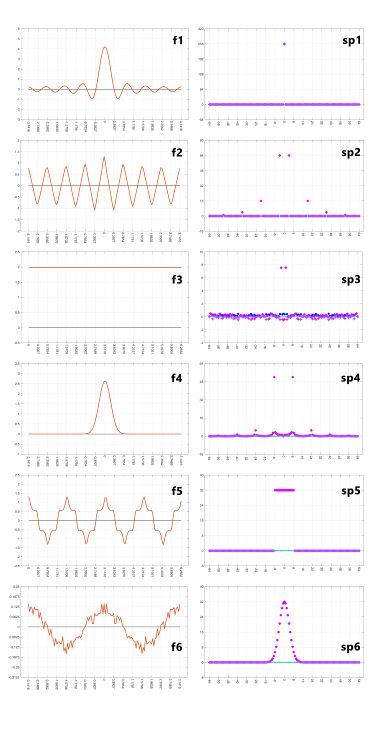
On the right, you see the graphs of six datasets (in red) with labels f1f6 as well as the visualization of six spectra (in blue
On the right, you see the graphs of six datasets (in red) with labels f1f6 as well as the visualization of six spectra (in blue and magenta you see the absolute value and the real part of the coefficients, respectively their imaginary parts are allzero here) with labels sp1sp6. For each f*, find the matching sp* and prepare a good explanation for why they match (under the Fourier transform).

Step by Step Solution
There are 3 Steps involved in it
Step: 1

Get Instant Access to Expert-Tailored Solutions
See step-by-step solutions with expert insights and AI powered tools for academic success
Step: 2

Step: 3

Ace Your Homework with AI
Get the answers you need in no time with our AI-driven, step-by-step assistance
Get Started


