

Answered step by step
Verified Expert Solution
Question
1 Approved Answer
On the tab labeled data you will find the financial data for problem #13 on page 489 in chapter 9. carefully read the statement of
On the tab labeled "data" you will find the financial data for problem #13 on page 489 in chapter 9. carefully read the statement of the problem in the textbook and then review the goven data.
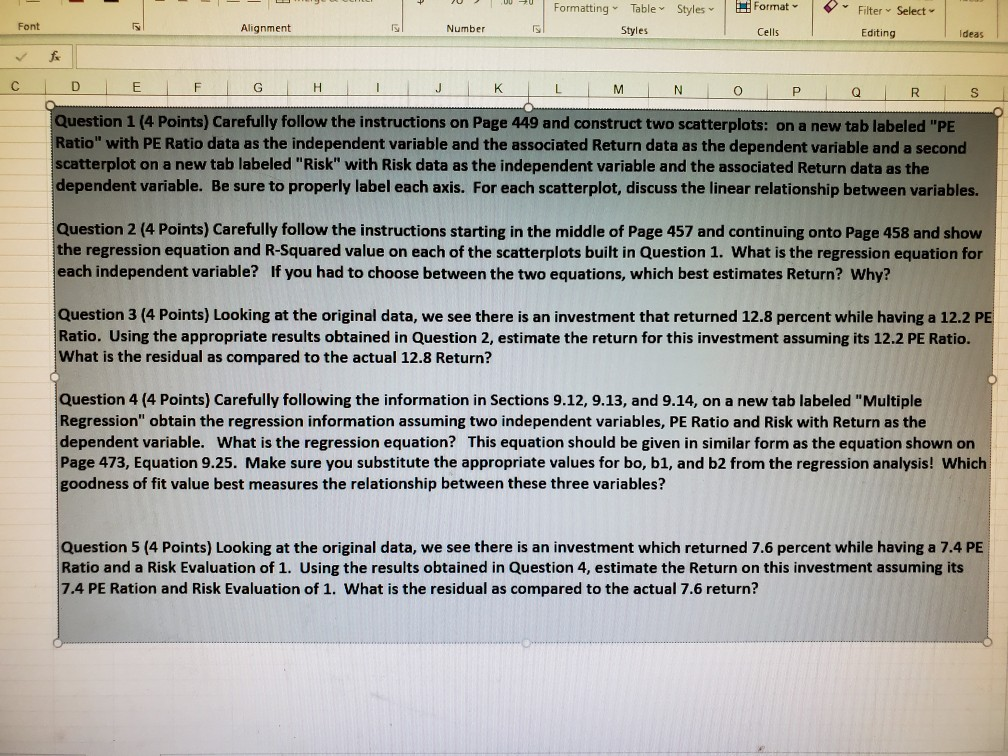
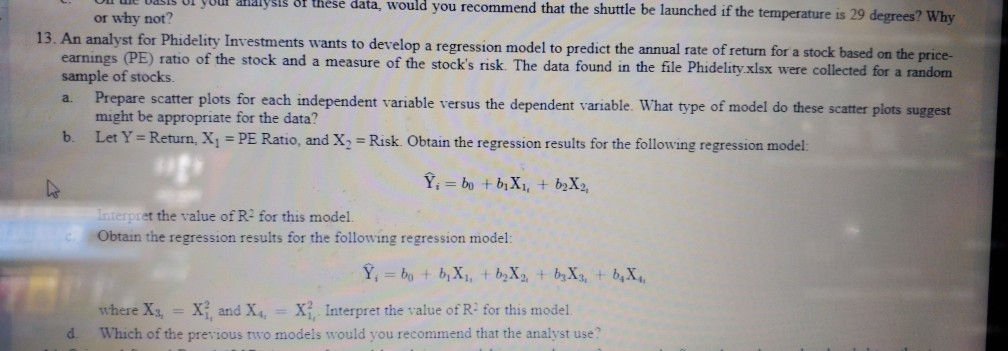
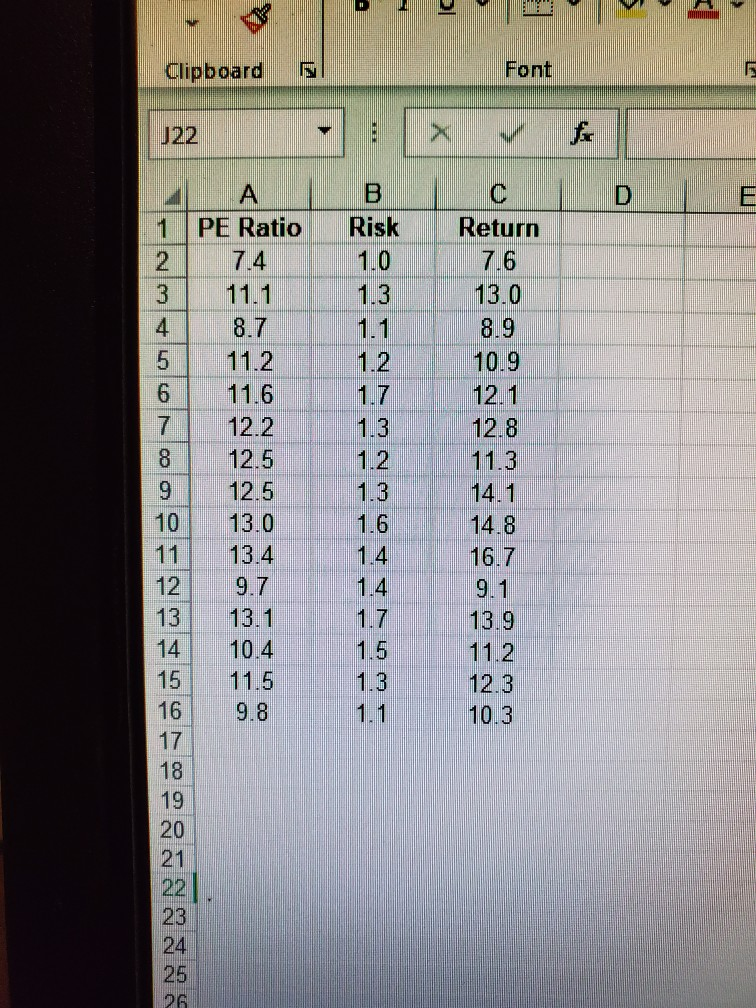
ve you andysis on these data would you recommend that the shuttle be launched if the temperature is 29 degrees? Why or why not? 13. An analyst for Phidelity Investments wants to develop a regression model to predict the annual rate of return for a stock based on the price- earnings (PE) ratio of the stock and a measure of the stock's risk. The data found in the file Phidelity.xlsx were collected for a random sample of stocks. a. Prepare scatter plots for each independent variable versus the dependent variable. What type of model do these scatter plots suggest might be appropriate for the data? b. Let Y= Return, X; = PE Ratio, and X = Risk. Obtain the regression results for the following regression model: Y; = bo +b X, + b2X2, Interpret the value of R for this model. Obtain the regression results for the following regression model: Y = Bo + 6, X, +6X + b X + 6, X, where X = X and X = X Interpret the value of R. for this model d. Which of the previous two models would you recommend that the analyst use? Clipboard Font J22 PE Ratio 27 74 1.0 > fac Risk Return 7.6 1.3 13.0 8.9 10.9 12.1 12.8 11.3 8.7 con E 11.2 11.6 12.2 12.5 12.5 13.0 13.4 9.7 13.1 AO WNWNN 14.1 14.8 16.7 9.1 13.9 11.2 12.3 10.3 N 10.4 11.5 W 9.8 1.1 uroopassa - UU U Formatting Styles Format Table Styles Filter Select Editing Font Alignment Number Cells Ideas C D E F G H I J K L M N O P Q R S Question 114 Points) Carefully follow the instructions on Page 449 and construct two scatterplots: on a new tab labeled "PE Ratio" with PE Ratio data as the independent variable and the associated Return data as the dependent variable and a second scatterplot on a new tab labeled "Risk" with Risk data as the independent variable and the associated Return data as the dependent variable. Be sure to properly label each axis. For each scatterplot, discuss the linear relationship between variables. Question 2 (4 Points) Carefully follow the instructions starting in the middle of Page 457 and continuing onto Page 458 and show the regression equation and R-Squared value on each of the scatterplots built in Question 1. What is the regression equation for each independent variable? If you had to choose between the two equations, which best estimates Return? Why? Question 3 (4 Points) Looking at the original data, we see there is an investment that returned 12.8 percent while having a 12.2 PE Ratio. Using the appropriate results obtained in Question 2, estimate the return for this investment assuming its 12.2 PE Ratio. What is the residual as compared to the actual 12.8 Return? Question 4 (4 Points) Carefully following the information in Sections 9.12, 9.13, and 9.14, on a new tab labeled "Multiple Regression" obtain the regression information assuming two independent variables, PE Ratio and Risk with Return as the dependent variable. What is the regression equation? This equation should be given in similar form as the equation shown on Page 473, Equation 9.25. Make sure you substitute the appropriate values for bo, b1, and b2 from the regression analysis! Which goodness of fit value best measures the relationship between these three variables? Question 5 (4 Points) Looking at the original data, we see there is an investment which returned 7.6 percent while having a 7.4 PE Ratio and a Risk Evaluation of 1. Using the results obtained in Question 4, estimate the Return on this investment assuming its 7.4 PE Ration and Risk Evaluation of 1. What is the residual as compared to the actual 7.6 return
Step by Step Solution
There are 3 Steps involved in it
Step: 1

Get Instant Access to Expert-Tailored Solutions
See step-by-step solutions with expert insights and AI powered tools for academic success
Step: 2

Step: 3
Ace Your Homework with AI
Get the answers you need in no time with our AI-driven, step-by-step assistance
Get Started
Pro SQL Server Administration
Authors: Peter Carter
1st Edition
1484207106, 9781484207109