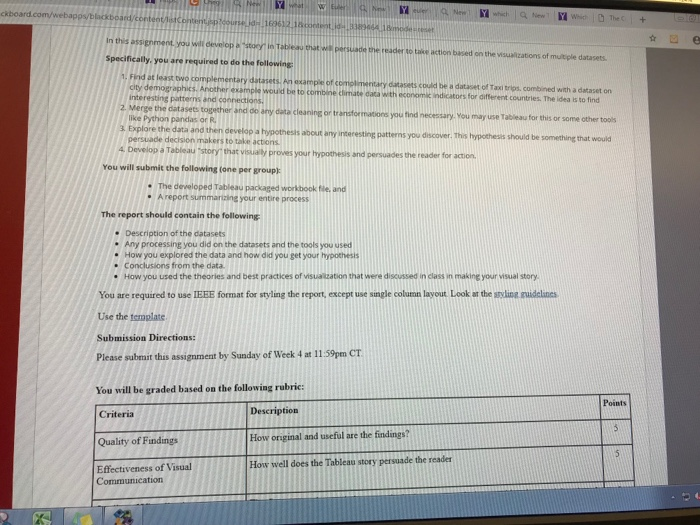
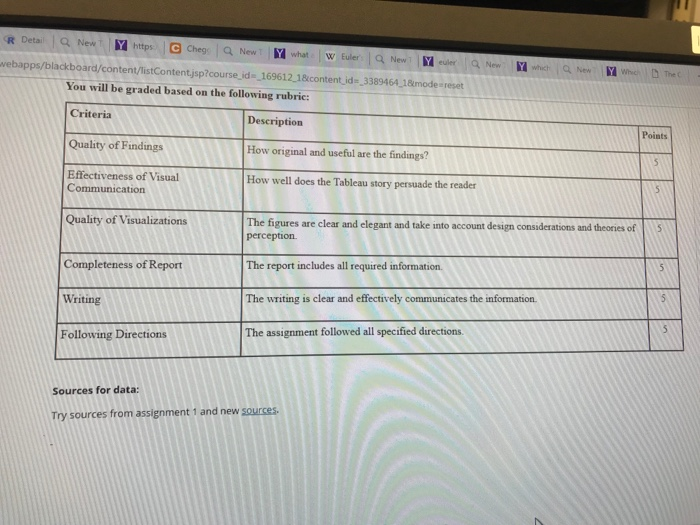
on the vsualzations of multiple datasets. An xmpe of complimentaty datasets could be a dataset of Taxi trips. combined with a dataset on or transformations you find necessary. You may use Tableau for this or some other tools s you discover. This hypothess should be something that would Specifically, you are required to do the follow 1. Firid at least two complementary datasets An cxampie of comolimentary datasets could be a d at least towo complementary datasets city demographics. Another example wouild be to combine dimate data with economc indicators for different countries. The idea is to find interesting patterns and connect like Python pandas or F 3 Explore the data and then develop a hoypothesis about any interest 4 Develop a Tableau "story that visualy proves your hypothesis and persuades the reader for action. persuade decision makers to take actions ing pattern You will submit the following (one per group The developed Tableau packaged workbook fle, and . Areport summarizine your entire process The report should contain the following Description of the datasets . Any processing you did on the datasets and the tools you used - How you explored the data and how did you get your hypothes Conclusions from the data. How you used the theories and best practices of visualization that were d scussed in class in making your visual story You are required to use TEEE format for styling the report, except use sinele column layout Look at the strvline udelincs Use the template Submission Directions: Please submit this assignment by Sunday of Week 4 at 11.59pm CT You will be graded based on the following rubric: Points Description How original and useful are the findings? How well does the Tableau story persuade the reader Criteria Quality of Findings Effectiveness of Visual Communication on the vsualzations of multiple datasets. An xmpe of complimentaty datasets could be a dataset of Taxi trips. combined with a dataset on or transformations you find necessary. You may use Tableau for this or some other tools s you discover. This hypothess should be something that would Specifically, you are required to do the follow 1. Firid at least two complementary datasets An cxampie of comolimentary datasets could be a d at least towo complementary datasets city demographics. Another example wouild be to combine dimate data with economc indicators for different countries. The idea is to find interesting patterns and connect like Python pandas or F 3 Explore the data and then develop a hoypothesis about any interest 4 Develop a Tableau "story that visualy proves your hypothesis and persuades the reader for action. persuade decision makers to take actions ing pattern You will submit the following (one per group The developed Tableau packaged workbook fle, and . Areport summarizine your entire process The report should contain the following Description of the datasets . Any processing you did on the datasets and the tools you used - How you explored the data and how did you get your hypothes Conclusions from the data. How you used the theories and best practices of visualization that were d scussed in class in making your visual story You are required to use TEEE format for styling the report, except use sinele column layout Look at the strvline udelincs Use the template Submission Directions: Please submit this assignment by Sunday of Week 4 at 11.59pm CT You will be graded based on the following rubric: Points Description How original and useful are the findings? How well does the Tableau story persuade the reader Criteria Quality of Findings Effectiveness of Visual Communication


