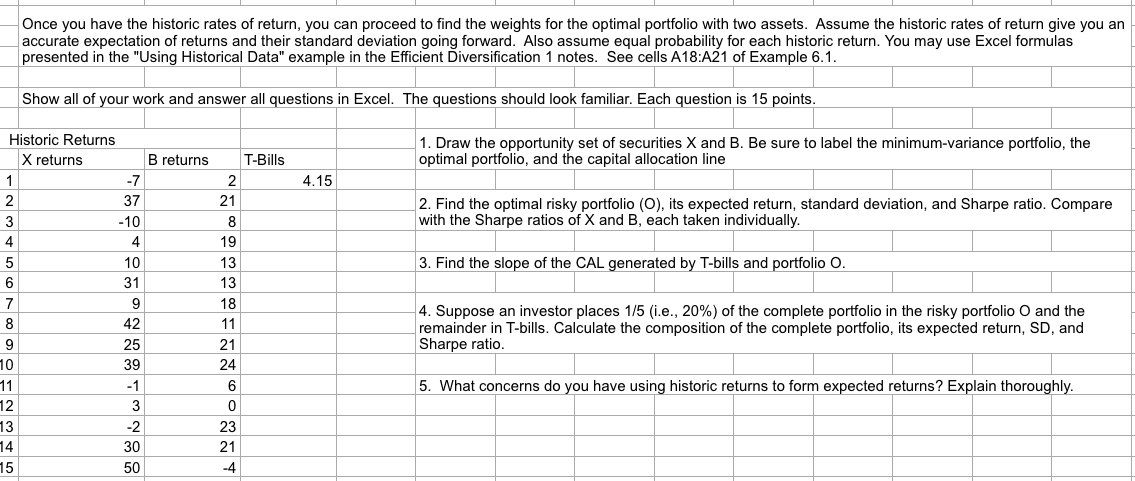
Once you have the historic rates of return, you can proceed to find the weights for the optimal portfolio with two assets. Assume the historic rates of return give you an accurate expectation of returns and their standard deviation going forward. Also assume equal probability for each historic return. You may use Excel formulas presented in the "Using Historical Data" example in the Efficient Diversification 1 notes. See cells A18:A21 of Example 6.1. Show all of your work and answer all questions in Excel. The questions should look familiar. Each question is 15 points. Historic Returns X returns B returns T-Bills 1. Draw the opportunity set of securities X and B. Be sure to label the minimum-variance portfolio, the optimal portfolio, and the capital allocation line 2 4.15 2 -7 37 21 2. Find the optimal risky portfolio (O), its expected return, standard deviation, and Sharpe ratio. Compare with the Sharpe ratios of X and B, each taken individually. 3. Find the slope of the CAL generated by T-bills and portfolio O. 4. Suppose an investor places 1/5 (i.e., 20%) of the complete portfolio in the risky portfolio O and the remainder in T-bills. Calculate the composition of the complete portfolio, its expected return, SD, and Sharpe ratio. 5. What concerns do you have using historic returns to form expected returns? Explain thoroughly. Once you have the historic rates of return, you can proceed to find the weights for the optimal portfolio with two assets. Assume the historic rates of return give you an accurate expectation of returns and their standard deviation going forward. Also assume equal probability for each historic return. You may use Excel formulas presented in the "Using Historical Data" example in the Efficient Diversification 1 notes. See cells A18:A21 of Example 6.1. Show all of your work and answer all questions in Excel. The questions should look familiar. Each question is 15 points. Historic Returns X returns B returns T-Bills 1. Draw the opportunity set of securities X and B. Be sure to label the minimum-variance portfolio, the optimal portfolio, and the capital allocation line 2 4.15 2 -7 37 21 2. Find the optimal risky portfolio (O), its expected return, standard deviation, and Sharpe ratio. Compare with the Sharpe ratios of X and B, each taken individually. 3. Find the slope of the CAL generated by T-bills and portfolio O. 4. Suppose an investor places 1/5 (i.e., 20%) of the complete portfolio in the risky portfolio O and the remainder in T-bills. Calculate the composition of the complete portfolio, its expected return, SD, and Sharpe ratio. 5. What concerns do you have using historic returns to form expected returns? Explain thoroughly