Answered step by step
Verified Expert Solution
Question
1 Approved Answer
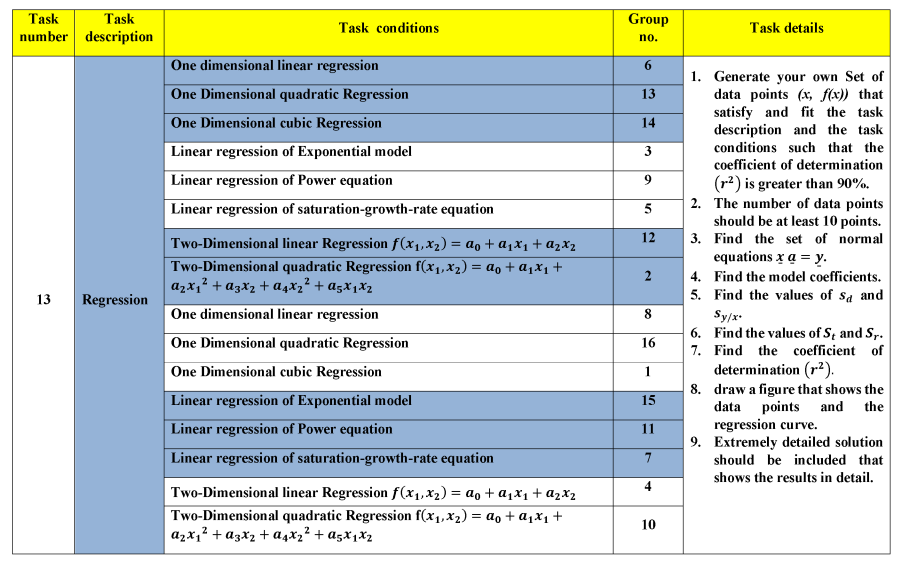
one dimensional only. matlab code for figures only other work by hand Task Task number description Task conditions Group no. Task details 6 13 14

one dimensional only. matlab code for figures only other work by hand
Task Task number description Task conditions Group no. Task details 6 13 14 3 9 5 12 = 2 1. Generate your own Set of data points (x, f(x)) that satisfy and fit the task description and the task conditions such that the coefficient of determination (r) is greater than 90%. 2. The number of data points should be at least 10 points. 3. Find the set of normal equations x a = y. 4. Find the model coefficients. 5. Find the values of Sd and Sy/x* 6. Find the values of Sand Sr. 7. Find the coefficient of determination (r). 8. draw a figure that shows the data points and the regression curve. 9. Extremely detailed solution should be included that shows the results in detail. 13 One dimensional linear regression One Dimensional quadratic Regression One Dimensional cubic Regression Linear regression of Exponential model Linear regression of Power equation Linear regression of saturation-growth-rate equation Two-Dimensional linear Regression f(x1,x2) = a, + a1x1 + a2x2 Two-Dimensional quadratic Regression f(x1, x2) = 0o + ax + azx12 + 23x2 + 04x22 + 25x142 One dimensional linear regression One Dimensional quadratic Regression One Dimensional cubic Regression Linear regression of Exponential model Linear regression of Power equation Linear regression of saturation-growth-rate equation Two-Dimensional linear Regression f(x1,x2) = 2, + a1x1 + a2x2 Two-Dimensional quadratic Regression f(x1,x2) = a + 21X1 + azx12 + 23x2 + 04x22 + a5x1x2 Regression 8 16 1 15 11 7 4 = 10 Task Task number description Task conditions Group no. Task details 6 13 14 3 9 5 12 = 2 1. Generate your own Set of data points (x, f(x)) that satisfy and fit the task description and the task conditions such that the coefficient of determination (r) is greater than 90%. 2. The number of data points should be at least 10 points. 3. Find the set of normal equations x a = y. 4. Find the model coefficients. 5. Find the values of Sd and Sy/x* 6. Find the values of Sand Sr. 7. Find the coefficient of determination (r). 8. draw a figure that shows the data points and the regression curve. 9. Extremely detailed solution should be included that shows the results in detail. 13 One dimensional linear regression One Dimensional quadratic Regression One Dimensional cubic Regression Linear regression of Exponential model Linear regression of Power equation Linear regression of saturation-growth-rate equation Two-Dimensional linear Regression f(x1,x2) = a, + a1x1 + a2x2 Two-Dimensional quadratic Regression f(x1, x2) = 0o + ax + azx12 + 23x2 + 04x22 + 25x142 One dimensional linear regression One Dimensional quadratic Regression One Dimensional cubic Regression Linear regression of Exponential model Linear regression of Power equation Linear regression of saturation-growth-rate equation Two-Dimensional linear Regression f(x1,x2) = 2, + a1x1 + a2x2 Two-Dimensional quadratic Regression f(x1,x2) = a + 21X1 + azx12 + 23x2 + 04x22 + a5x1x2 Regression 8 16 1 15 11 7 4 = 10Step by Step Solution
There are 3 Steps involved in it
Step: 1

Get Instant Access to Expert-Tailored Solutions
See step-by-step solutions with expert insights and AI powered tools for academic success
Step: 2

Step: 3

Ace Your Homework with AI
Get the answers you need in no time with our AI-driven, step-by-step assistance
Get Started


