Answered step by step
Verified Expert Solution
Question
1 Approved Answer
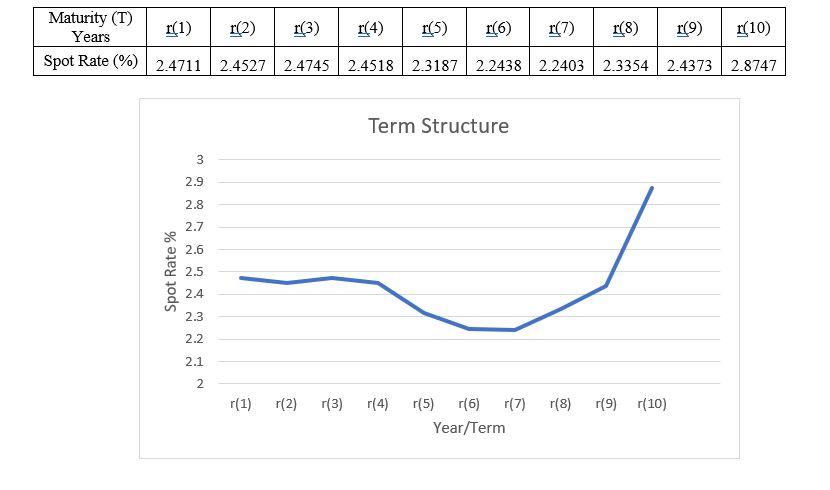
One of your colleagues is looking at the yield curve expressed by the information below and asks for an explanation as to why it has
One of your colleagues is looking at the yield curve expressed by the information below and asks for an explanation as to why it has the current shape. Describe the shape of the term structure presented in the table below. Explain the shape using the two forms of the biased expectations theory your answer should define the two forms, and explain why they are referred to as biased.

Step by Step Solution
There are 3 Steps involved in it
Step: 1

Get Instant Access to Expert-Tailored Solutions
See step-by-step solutions with expert insights and AI powered tools for academic success
Step: 2

Step: 3

Ace Your Homework with AI
Get the answers you need in no time with our AI-driven, step-by-step assistance
Get Started


