

Question: One way to see whether this procedure will be successful is to split the original data set into two subsets: one subset for estimation
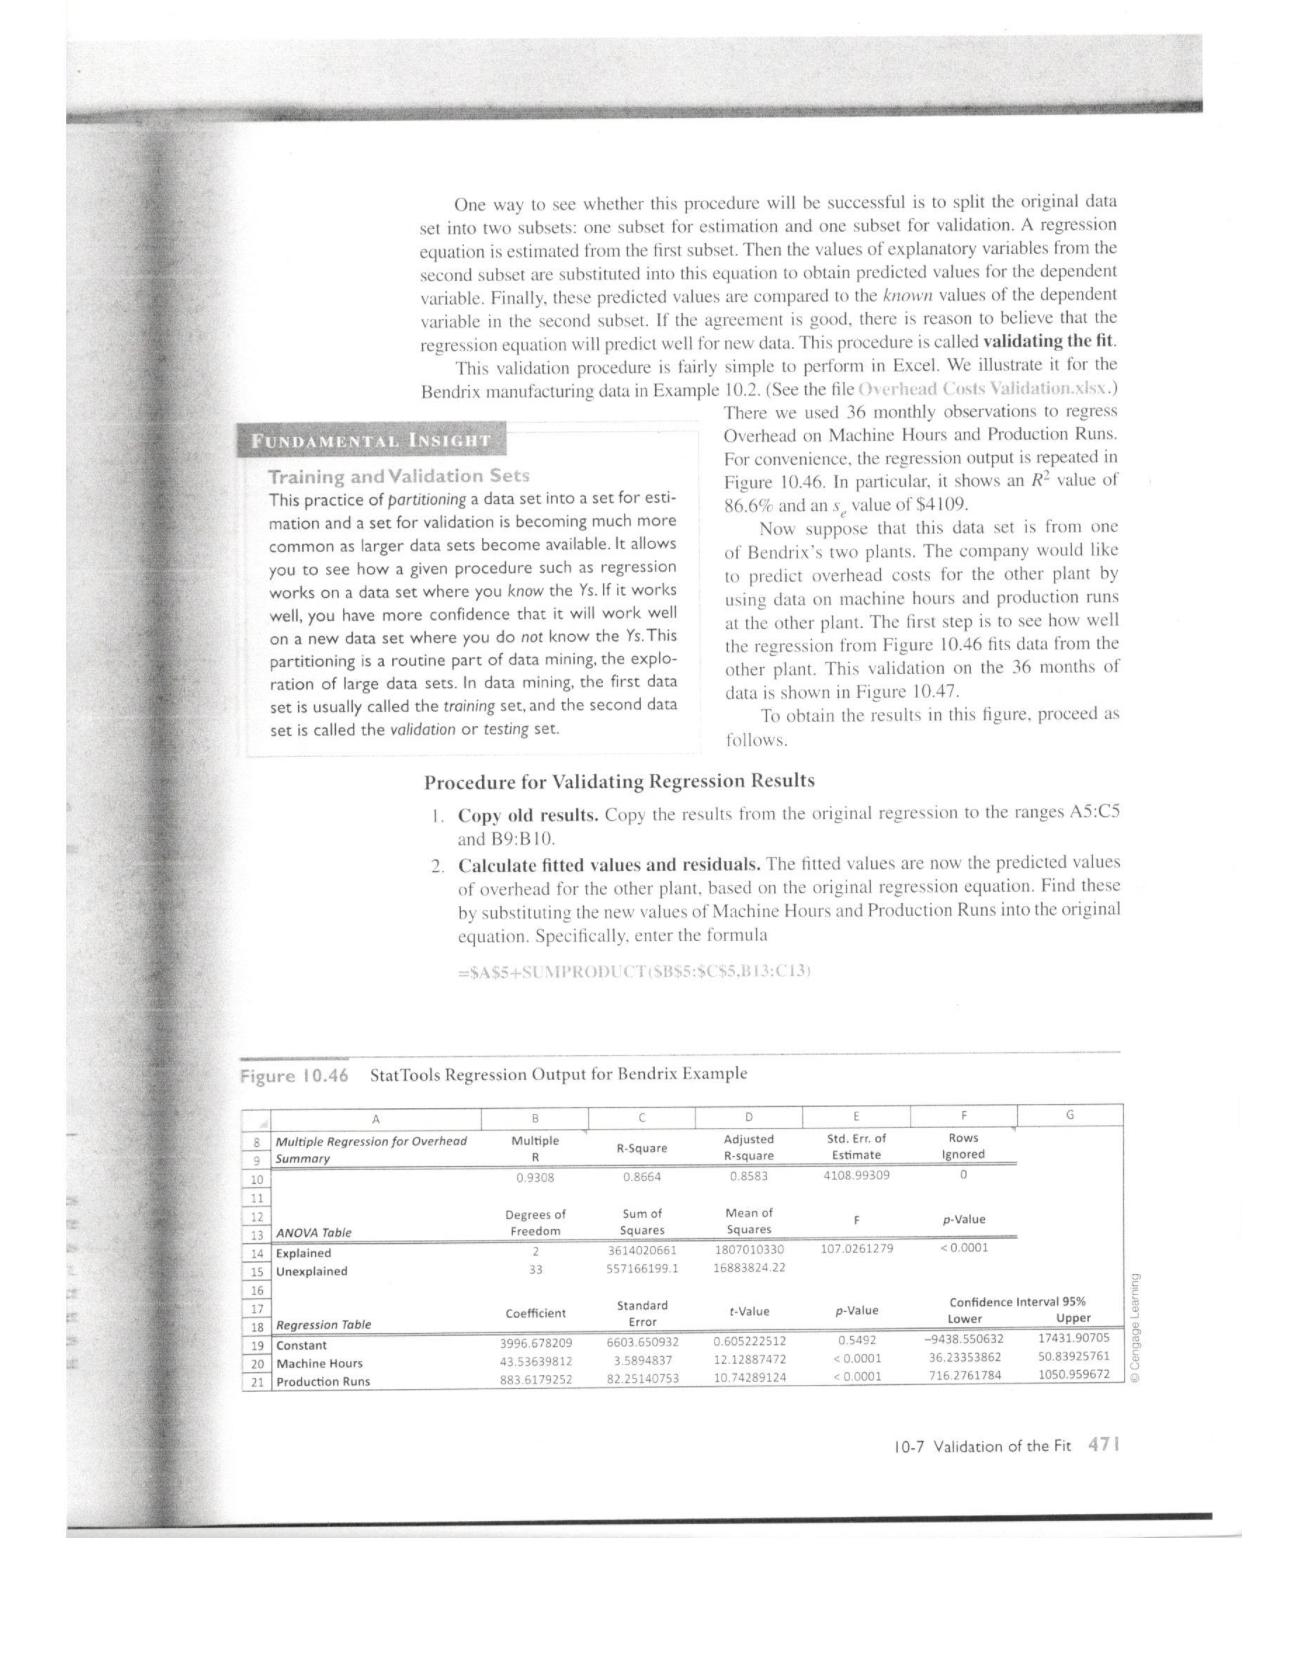
One way to see whether this procedure will be successful is to split the original data set into two subsets: one subset for estimation and one subset for validation. A regression equation is estimated from the first subset. Then the values of explanatory variables from the second subset are substituted into this equation to obtain predicted values for the dependent variable. Finally, these predicted values are compared to the known values of the dependent variable in the second subset. If the agreement is good, there is reason to believe that the regression equation will predict well for new data. This procedure is called validating the fit. This validation procedure is fairly simple to perform in Excel. We illustrate it for the Bendrix manufacturing data in Example 10.2. (See the file Overhead Costs Validation.xlsx.) FUNDAMENTAL INSIGHT Training and Validation Sets This practice of partitioning a data set into a set for esti- mation and a set for validation is becoming much more common as larger data sets become available. It allows you to see how a given procedure such as regression works on a data set where you know the Ys. If it works well, you have more confidence that it will work well on a new data set where you do not know the Ys. This partitioning is a routine part of data mining, the explo- ration of large data sets. In data mining, the first data set is usually called the training set, and the second data set is called the validation or testing set. There we used 36 monthly observations to regress Overhead on Machine Hours and Production Runs. For convenience, the regression output is repeated in Figure 10.46. In particular, it shows an R value of 86.6% and an s value of $4109. Now suppose that this data set is from one of Bendrix's two plants. The company would like to predict overhead costs for the other plant by using data on machine hours and production runs at the other plant. The first step is to see how well the regression from Figure 10.46 fits data from the other plant. This validation on the 36 months of data is shown in Figure 10.47. To obtain the results in this figure, proceed as follows. Procedure for Validating Regression Results 1. Copy old results. Copy the results from the original regression to the ranges A5:C5 and B9:B10. 2. Calculate fitted values and residuals. The fitted values are now the predicted values of overhead for the other plant, based on the original regression equation. Find these by substituting the new values of Machine Hours and Production Runs into the original equation. Specifically, enter the formula =A55-SUMPRODUCTSB:5:05BE3:013) Figure 10.46 Stat Tools Regression Output for Bendrix Example A B C 8 Multiple Regression for Overhead Summary Multiple R-Square R 10 0.9308 0.8664 D Adjusted R-square 0.8583 F G Std. Err. of Estimate 4108.99309 Rows Ignored 0 11 12 13 ANOVA Table Degrees of Freedom 14 Explained 15 Unexplained 2 33 Sum of Squares 3614020661 557166199.1 Mean of Squares 1807010330 16883824.22 107.0261279 p-Value
Step by Step Solution
There are 3 Steps involved in it
Lets address each question 1 The Rsquare or coefficient of determination measures the proportion of the variance in the dependent variable Overhead that is explained by the independent variables Machi... View full answer

Get step-by-step solutions from verified subject matter experts