Answered step by step
Verified Expert Solution
Question
1 Approved Answer
only answer problem 4, lab exercise 5 is given below Problem 4: (4 pts) Recreate your plot from lab exercise 5 using the seaborn package
only answer problem 4, lab exercise 5 is given below
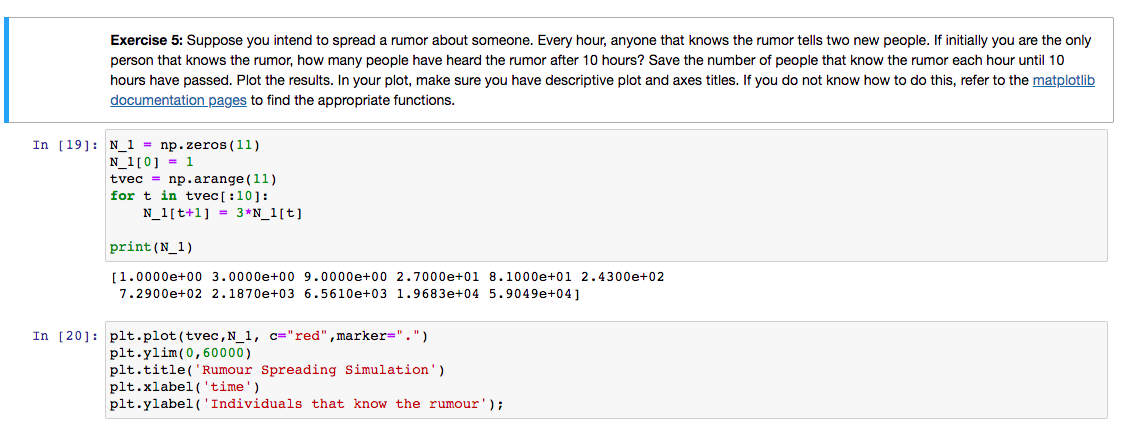
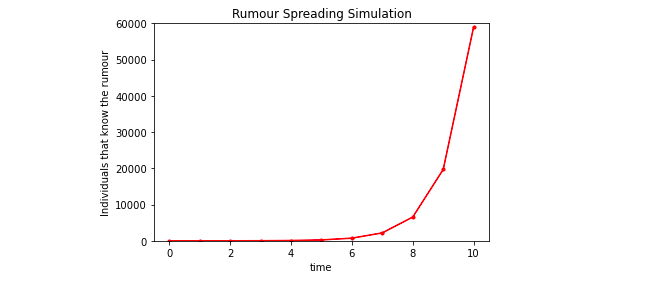
Problem 4: (4 pts) Recreate your plot from lab exercise 5 using the seaborn package with all of the same plot elements, including plot title and axes titles. (The seaborn package will be useful for your final projects.) Refer to the seaborn documentation for help. Exercise 5: Suppose you intend to spread a rumor about someone. Every hour, anyone that knows the rumor tells two new people. If initially you are the only person that knows the rumor, how many people have heard the rumor after 10 hours? Save the number of people that know the rumor each hour until 10 hours have passed. Plot the results. In your plot, make sure you have descriptive plot and axes titles. If you do not know how to do this, refer to the matplotlib documentation pages to find the appropriate functions. In [19]: N_1 = np.zeros(11) N_1[0] = 1 tvec = np.arange(11) for t in tvec[:10]: N_1[t+1] = 3*N_1[t] print(N_1) [1.0000e+00 3.0000e+00 9.0000e+00 2.7000e+01 8.1000e+01 2.4300e+02 7.2900e+02 2.1870e+03 6.5610e+03 1.9683e+04 5.9049e+04] In [20]: plt.plot(tvec, N_1, c="red", marker=",") plt.ylim(0,60000) plt.title( 'Rumour Spreading Simulation') plt.xlabel('time') plt.ylabel('Individuals that know the rumour'); Rumour Spreading Simulation 00009 50000 40000 Individuals that know the rumour 30000 20000 10000 0 - 0 6 00 8 10 N timeStep by Step Solution
There are 3 Steps involved in it
Step: 1
Get Instant Access to Expert-Tailored Solutions
See step-by-step solutions with expert insights and AI powered tools for academic success
Step: 2
Step: 3
Ace Your Homework with AI
Get the answers you need in no time with our AI-driven, step-by-step assistance
Get Started