 ONLY NEED HELP FROM B AND DOWN THANK YOU
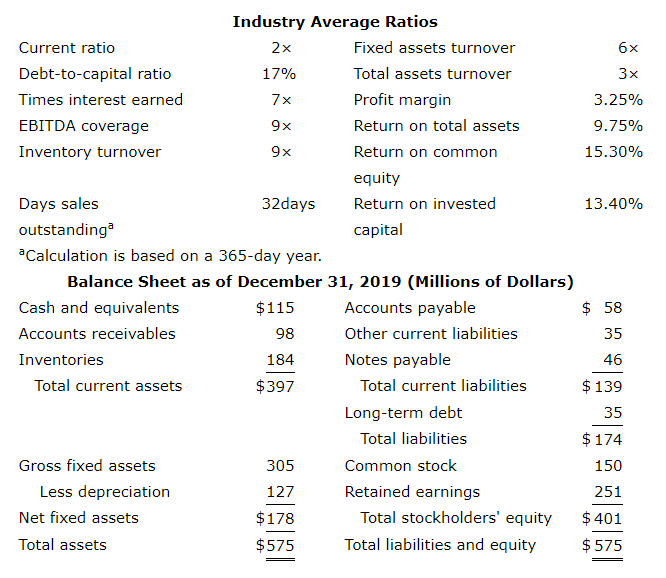
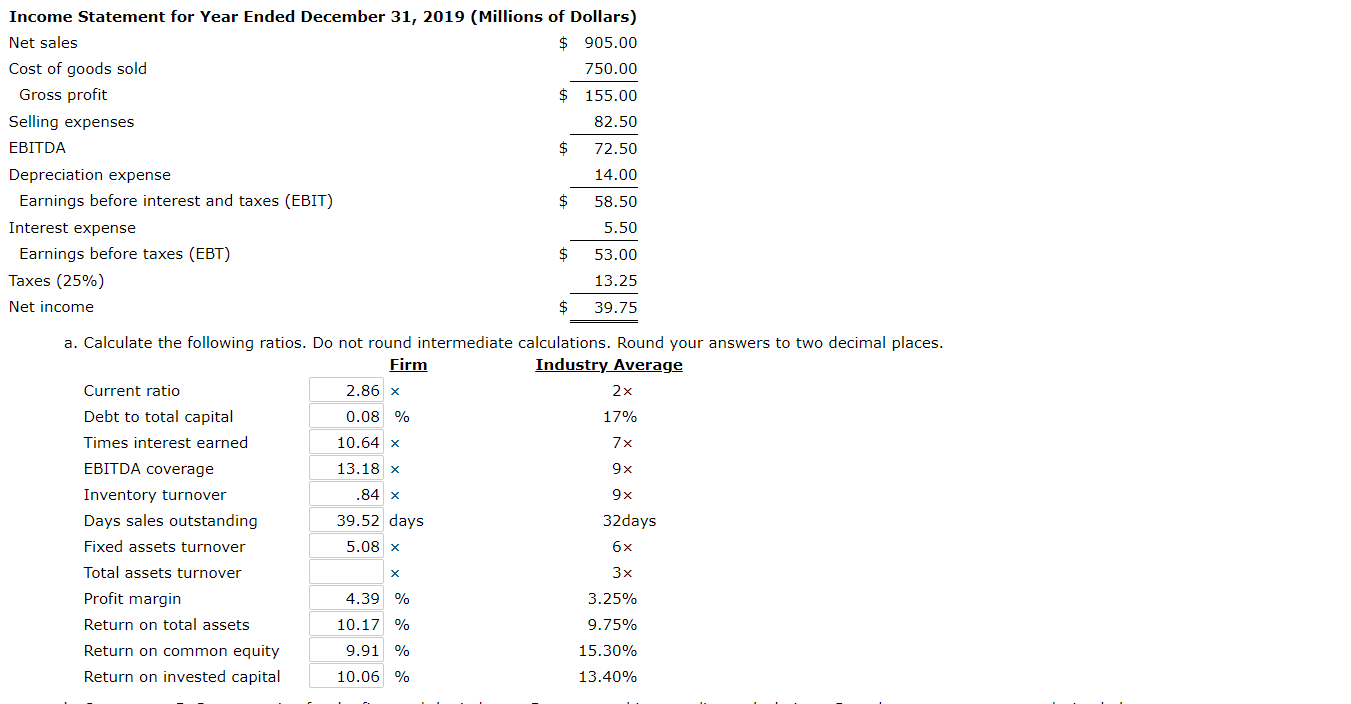
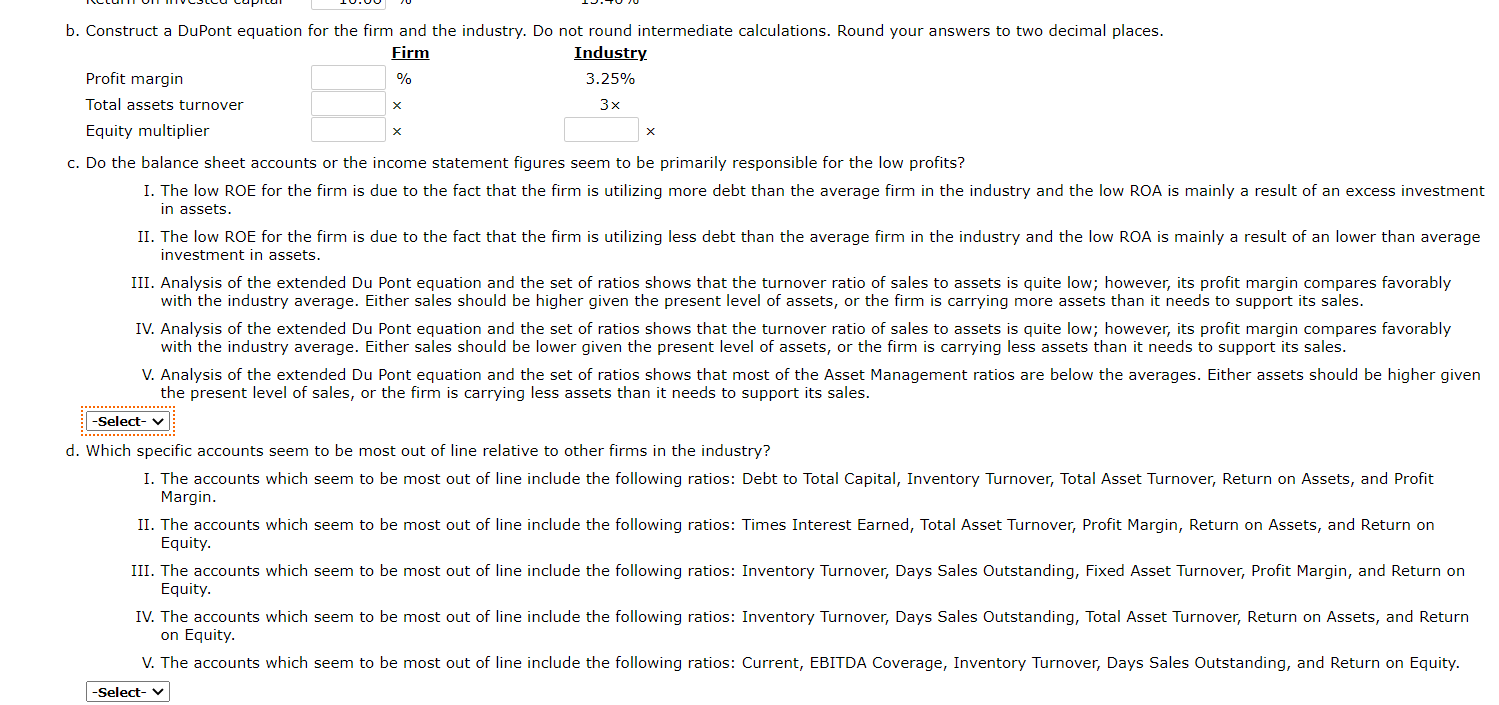
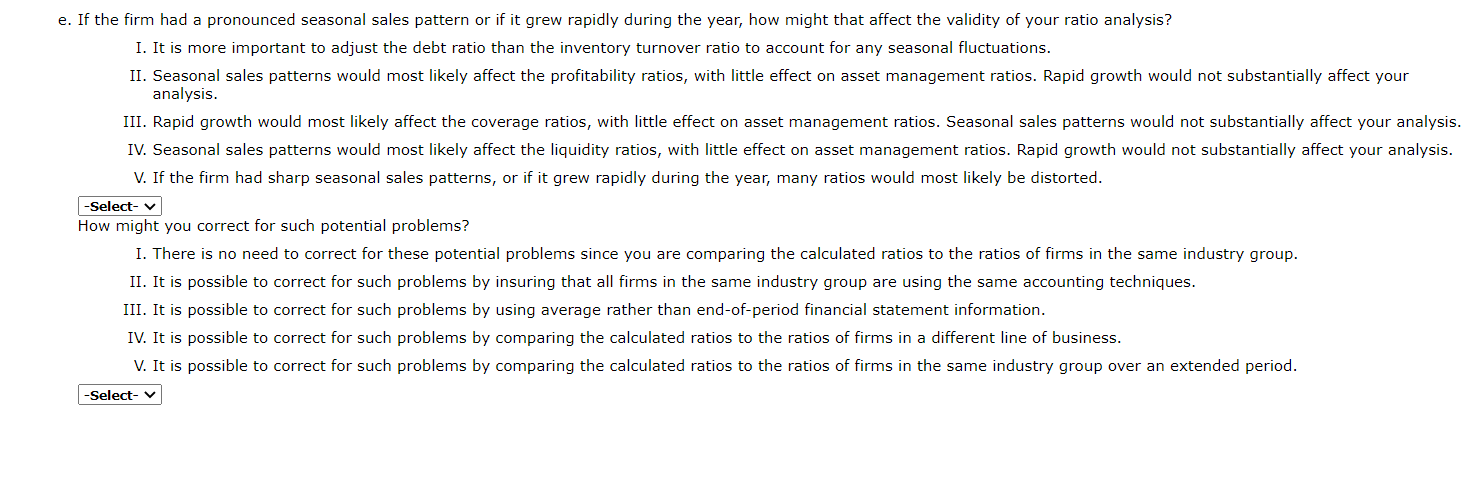
2x Industry Average Ratios Current ratio Fixed assets turnover 6x Debt-to-capital ratio 17% Total assets turnover 3x Times interest earned 7x Profit margin 3.25% EBITDA coverage 9x Return on total assets 9.75% Inventory turnover 9x Return on common 15.30% equity Days sales 32days Return on invested 13.40% outstandinga capital aCalculation is based on a 365-day year. Balance Sheet as of December 31, 2019 (Millions of Dollars) Cash and equivalents $ 115 Accounts payable $ 58 Accounts receivables 98 Other current liabilities 35 Inventories 184 Notes payable 46 Total current assets $397 Total current liabilities $ 139 Long-term debt 35 Total liabilities $ 174 Gross fixed assets 305 Common stock 150 Less depreciation 127 Retained earnings 251 Net fixed assets $178 Total stockholders' equity $ 401 Total assets $575 Total liabilities and equity $575 Income Statement for Year Ended December 31, 2019 (Millions of Dollars) Net sales $ 905.00 Cost of goods sold 750.00 Gross profit $ 155.00 Selling expenses 82.50 EBITDA $ 72.50 Depreciation expense 14.00 Earnings before interest and taxes (EBIT) $ 58.50 Interest expense 5.50 Earnings before taxes (EBT) $ 53.00 Taxes (25%) 13.25 Net income $ 39.75 17% a. Calculate the following ratios. Do not round intermediate calculations. Round your answers to two decimal places. Firm Industry Average Current ratio 2.86 x 2x Debt to total capital 0.08 % Times interest earned 10.64 x 7x EBITDA coverage 13.18 x 9x Inventory turnover .84 x 9x Days sales outstanding 39.52 days 32days Fixed assets turnover 5.08 x 6x Total assets turnover 3x Profit margin 4.39 % 3.25% Return on total assets 10.17 % 9.75% Return on common equity 9.91 % 15.30% Return on invested capital 10.06 % 13.40% X b. Construct a DuPont equation for the firm and the industry. Do not round intermediate calculations. Round your answers to two decimal places. Firm Industry Profit margin % 3.25% Total assets turnover 3x Equity multiplier c. Do the balance sheet accounts or the income statement figures seem to be primarily responsible for the low profits? I. The low ROE for the firm is due to the fact that the firm is utilizing more debt than the average firm in the industry and the low ROA is mainly a result of an excess investment in assets. II. The low ROE for the firm is due to the fact that the firm is utilizing less debt than the average firm in the industry and the low ROA is mainly a result of an lower than average investment in assets. III. Analysis of the extended Du Pont equation and the set of ratios shows that the turnover ratio of sales to assets is quite low; however, its profit margin compares favorably with the industry average. Either sales should be higher given the present level of assets, or the firm is carrying more assets than it needs to support its sales. IV. Analysis of the extended Du Pont equation and the set of ratios shows that the turnover ratio of sales to assets is quite low; however, its profit margin compares favorably with the industry average. Either sales should be lower given the present level of assets, or the firm is carrying less assets than it needs to support its sales. V. Analysis of the extended Du Pont equation and the set of ratios shows that most of the Asset Management ratios are below the averages. Either assets should be higher given the present level of sales, or the firm is carrying less assets than it needs to support its sales. -Select- d. Which specific accounts seem to be most out of line relative to other firms in the industry? I. The accounts which seem to be most out of line include the following ratios: Debt to Total Capital, Inventory Turnover, Total Asset Turnover, Return on Assets, and Profit Margin. II. The accounts which seem to be most out of line include the following ratios: Times Interest Earned, Total Asset Turnover, Profit Margin, Return on Assets, and Return on Equity. III. The accounts which seem to be most out of line include the following ratios: Inventory Turnover, Days Sales Outstanding, Fixed Asset Turnover, Profit Margin, and Return on Equity. IV. The accounts which seem to be most out of line include the following ratios: Inventory Turnover, Days Sales Outstanding, Total Asset Turnover, Return on Assets, and Return on Equity. V. The accounts which seem to be most out of line include the following ratios: Current, EBITDA Coverage, Inventory Turnover, Days Sales Outstanding, and Return on Equity. -Select- e. If the firm had a pronounced seasonal sales pattern or if it grew rapidly during the year, how might that affect the validity of your ratio analysis? I. It is more important to adjust the debt ratio than the inventory turnover ratio to account for any seasonal fluctuations. II. Seasonal sales patterns would most likely affect the profitability ratios, with little effect on asset management ratios. Rapid growth would not substantially affect your analysis. III. Rapid growth would most likely affect the coverage ratios, with little effect on asset management ratios. Seasonal sales patterns would not substantially affect your analysis. IV. Seasonal sales patterns would most likely affect the liquidity ratios, with little effect on asset management ratios. Rapid growth would not substantially affect your analysis. V. If the firm had sharp seasonal sales patterns, or if it grew rapidly during the year, many ratios would most likely be distorted. -Select- How might you correct for such potential problems? I. There is no need to correct for these potential problems since you are comparing the calculated ratios to the ratios of firms in the same industry group. II. It is possible to correct for such problems by insuring that all firms in the same industry group are using the same accounting techniques. III. It is possible to correct for such problems by using average rather than end-of-period financial statement information. IV. It is possible to correct for such problems by comparing the calculated ratios to the ratios of firms in a different line of business. V. It is possible to correct for such problems by comparing the calculated ratios to the ratios of firms in the same industry group over an extended period. -Select- 2x Industry Average Ratios Current ratio Fixed assets turnover 6x Debt-to-capital ratio 17% Total assets turnover 3x Times interest earned 7x Profit margin 3.25% EBITDA coverage 9x Return on total assets 9.75% Inventory turnover 9x Return on common 15.30% equity Days sales 32days Return on invested 13.40% outstandinga capital aCalculation is based on a 365-day year. Balance Sheet as of December 31, 2019 (Millions of Dollars) Cash and equivalents $ 115 Accounts payable $ 58 Accounts receivables 98 Other current liabilities 35 Inventories 184 Notes payable 46 Total current assets $397 Total current liabilities $ 139 Long-term debt 35 Total liabilities $ 174 Gross fixed assets 305 Common stock 150 Less depreciation 127 Retained earnings 251 Net fixed assets $178 Total stockholders' equity $ 401 Total assets $575 Total liabilities and equity $575 Income Statement for Year Ended December 31, 2019 (Millions of Dollars) Net sales $ 905.00 Cost of goods sold 750.00 Gross profit $ 155.00 Selling expenses 82.50 EBITDA $ 72.50 Depreciation expense 14.00 Earnings before interest and taxes (EBIT) $ 58.50 Interest expense 5.50 Earnings before taxes (EBT) $ 53.00 Taxes (25%) 13.25 Net income $ 39.75 17% a. Calculate the following ratios. Do not round intermediate calculations. Round your answers to two decimal places. Firm Industry Average Current ratio 2.86 x 2x Debt to total capital 0.08 % Times interest earned 10.64 x 7x EBITDA coverage 13.18 x 9x Inventory turnover .84 x 9x Days sales outstanding 39.52 days 32days Fixed assets turnover 5.08 x 6x Total assets turnover 3x Profit margin 4.39 % 3.25% Return on total assets 10.17 % 9.75% Return on common equity 9.91 % 15.30% Return on invested capital 10.06 % 13.40% X b. Construct a DuPont equation for the firm and the industry. Do not round intermediate calculations. Round your answers to two decimal places. Firm Industry Profit margin % 3.25% Total assets turnover 3x Equity multiplier c. Do the balance sheet accounts or the income statement figures seem to be primarily responsible for the low profits? I. The low ROE for the firm is due to the fact that the firm is utilizing more debt than the average firm in the industry and the low ROA is mainly a result of an excess investment in assets. II. The low ROE for the firm is due to the fact that the firm is utilizing less debt than the average firm in the industry and the low ROA is mainly a result of an lower than average investment in assets. III. Analysis of the extended Du Pont equation and the set of ratios shows that the turnover ratio of sales to assets is quite low; however, its profit margin compares favorably with the industry average. Either sales should be higher given the present level of assets, or the firm is carrying more assets than it needs to support its sales. IV. Analysis of the extended Du Pont equation and the set of ratios shows that the turnover ratio of sales to assets is quite low; however, its profit margin compares favorably with the industry average. Either sales should be lower given the present level of assets, or the firm is carrying less assets than it needs to support its sales. V. Analysis of the extended Du Pont equation and the set of ratios shows that most of the Asset Management ratios are below the averages. Either assets should be higher given the present level of sales, or the firm is carrying less assets than it needs to support its sales. -Select- d. Which specific accounts seem to be most out of line relative to other firms in the industry? I. The accounts which seem to be most out of line include the following ratios: Debt to Total Capital, Inventory Turnover, Total Asset Turnover, Return on Assets, and Profit Margin. II. The accounts which seem to be most out of line include the following ratios: Times Interest Earned, Total Asset Turnover, Profit Margin, Return on Assets, and Return on Equity. III. The accounts which seem to be most out of line include the following ratios: Inventory Turnover, Days Sales Outstanding, Fixed Asset Turnover, Profit Margin, and Return on Equity. IV. The accounts which seem to be most out of line include the following ratios: Inventory Turnover, Days Sales Outstanding, Total Asset Turnover, Return on Assets, and Return on Equity. V. The accounts which seem to be most out of line include the following ratios: Current, EBITDA Coverage, Inventory Turnover, Days Sales Outstanding, and Return on Equity. -Select- e. If the firm had a pronounced seasonal sales pattern or if it grew rapidly during the year, how might that affect the validity of your ratio analysis? I. It is more important to adjust the debt ratio than the inventory turnover ratio to account for any seasonal fluctuations. II. Seasonal sales patterns would most likely affect the profitability ratios, with little effect on asset management ratios. Rapid growth would not substantially affect your analysis. III. Rapid growth would most likely affect the coverage ratios, with little effect on asset management ratios. Seasonal sales patterns would not substantially affect your analysis. IV. Seasonal sales patterns would most likely affect the liquidity ratios, with little effect on asset management ratios. Rapid growth would not substantially affect your analysis. V. If the firm had sharp seasonal sales patterns, or if it grew rapidly during the year, many ratios would most likely be distorted. -Select- How might you correct for such potential problems? I. There is no need to correct for these potential problems since you are comparing the calculated ratios to the ratios of firms in the same industry group. II. It is possible to correct for such problems by insuring that all firms in the same industry group are using the same accounting techniques. III. It is possible to correct for such problems by using average rather than end-of-period financial statement information. IV. It is possible to correct for such problems by comparing the calculated ratios to the ratios of firms in a different line of business. V. It is possible to correct for such problems by comparing the calculated ratios to the ratios of firms in the same industry group over an extended period. -Select