

Question
Only need help with warranty cost. Balboa Security v. M&M Systems: Determining Commercial Damages Eroding Margins and a Solution During 2010 through 2012, the companys
Only need help with warranty cost.
Balboa Security v. M&M Systems: Determining Commercial Damages
Eroding Margins and a Solution
During 2010 through 2012, the companys gross margin began slipping. Balboas CFO, Sara Xu, analyzed the historical financial information and identified a primary cause of the slipping margin: the rising cost of security sensors. Each security system had one or more control panels and dozens, or even hundreds, of security sensors which monitored movement, heat changes, and other environmental factors. Sensor Systems, Inc. had been Balboas sole source of sensors since 1995. While the quality of the sensors was very good, these recent price increases were reducing the bottom line and the Company wanted to control this trend before it got worse.
The purchasing department was instructed to seek out alternative vendors. The selection process took several months and included a product testing phase. Based on these tests, and on what appeared to be a good fit with Balboa, M&M Systems was selected to become the sole supplier for security sensors. M&M had been in business for over 15 years and carried an excellent reputation. M&M offered a steep discount on pricing when compared to Sensor Systems; however, the sensors were sold with no right of return. Additionally, Balboa would clearly be M&Ms largest account. When asked about this, M&M assured Balboa they could handle the work and meet the volume requirements. Based on these assurances from M&M regarding the ability to meet Balboas demand for product, and after considering M&Ms reputation and the significant cost savings, Balboa confidently made the transition to M&M for sensors beginning in May of 2013.
A Problem Develops
One of the innovative features included in Balboas systems was an internal testing unit that allowed the customers to pre-scan for any likely system problems. This was one of the many product features that contributed to the financial success of the company.
Based on Balboas experience, approximately 1% to 2% of the sensors would either fail or register in the pre-test as potentially failing during the first year of operations. Balboa would make necessary repairs before any real problems developed.
It was business as usual through most of 2013. However, beginning in November of 2013, there was an unusually high number of sensor failures reported. The normally minimal cost of warranty repairs began increasing at an alarming rate and Balboa could not keep up with the growing demand for repairs. Even worse, word was getting out that the quality of Balboas systems was slipping. For the first time in years, Balboas sales declined from the prior year.
Identification of the Issue
Balboas repair teams quickly identified the M&M sensors as the cause of the increase in maintenance problems. The repair teams were replacing defective M&M sensors with new M&M sensors. However, they soon realized a second wave of repair calls came as the replacement sensors went bad.
Discussions with M&M
When the problems were first discovered, Balboa contacted M&M regarding the quality issues. M&M assured Balboa that any quality issue was temporary and there was no reason to be concerned. However, Balboa management didnt see any change in reliability or quality. Sensor failures continued and the negative impact on Balboas business increased each day. After repeated attempts to correct the situation and address the quality issues, Balboa management recognized a change had to be made. The last purchase from M&M was made in April of 2014. Unfortunately, by this time, significant damage was done. Balboas reputation was tarnished, sales were down, and repair costs continued to rise. In June of 2014, Balboa brought a lawsuit against M&M for damages.
Forensic Analysis
One Monday afternoon in late September of 2014 you were contacted by the partner in charge of forensic services at your CPA firm, Kylie Galvan. Kylie explained she received a call from attorney Laurel Zander earlier that day regarding the case. Kylie provided you with a brief overview of the case and feltyou were up for the challenge.
After receiving the requested financial information, you toured the Balboa facility and interviewed key personnel regarding the case. Based on your tour, Balboas operations appeared well-organized and efficient; however, you did get the impression there had been more than the usual amount of labor turnover, especially in the installer department. You observed that the business clearly had capacity to increase annual sales by 20% to 25% without adding significantly to overhead costs.
Your review of economic conditions for the five years prior to the damage event and the forecast of future economic conditions indicates the economy is stable with continued growth expected. The securities industry is aligned with economic conditions; industry experts expect continued growth at a moderate pace for the five years following the event.
Key excerpts from your interviews with Balboa personnel:
Balboa Shipping Department Manager: We carefully pack all components for every job. We transport the components using the same vendors we have always used. If the job is local (within 200 miles) we use our own trucks. If the customer is out of our area, we use reputable transport service providers, the same ones we have used for many years. From what I hear, M&M claims we dont know what we are doing, which doesnt make any sense to me at all.
Balboa Installer Department Manager: Turnover has been a problem in my division. We have taken steps to rectify this issue, but turnover has resulted in inexperienced installers being used all too often. We tried to schedule all jobs with at least one experienced technician, but that wasnt always possible. I think we have the problem under control now.
Balboa Engineering Department Manager: Quality control is important to our business. We have been using the same quality control measures for over 10 years. Our approach has proven to be effective and efficient. No controls can compensate for poor quality sensors that fail after being in service for several months. We expect to incur continuing warranty repair costs on this for at least two more years.
Balboa Inventory Department Manager: We were stocked for sales of nearly $16 million for 2014 when this problem occurred. In addition to the $175,000 of questionable M&M sensors, we have consoles, cabling, connectors, all kinds of products on hand. Our warehouse is stacked from top to bottom. M&M refused to take back the unused sensors claiming they are fine of course, the litigation probably affected that decision. We cant afford to use the M&M products and we need the warehouse space. We found a business willing to give us ten cents on the dollar for the M&M sensors and we are in the process of closing that transaction right now.
Balboa Marketing Department Manager: Our analysis indicates sales will be negatively impacted for at least three years. We expect a decline in sales of 12% in 2015, 8% in 2016, and 4% in 2017. We have had to increase advertising expenditures to get a start on this. We are planning increased advertising over the next four years at 75% over historical averages for 2015 followed by 60%, 30% and 15% for each of the following years. Even with this additional cost, return to what we were before will be difficult.
Bruce Berry, Balboa CEO: In addition to the warranty replacement costs, our reputation has been seriously damaged. It will take years to rebuild, if it can be rebuilt at all.
Shortly after your visit to the Balboa offices you interviewed key personnel from M&M:
M&M Production Department Manager: The significant production volume necessary to keep Balboa stocked did put stress on our quality control systems, but we provided top quality sensors.
M&M Engineering Department Manager: Balboas installation process may be causing the problems. These sensors can be damaged by rough handling. We take great care to properly pack the sensors before they are shipped. I have no idea what happens to them once Balboa gets their hands on our product.
M&M CEO: We have been in business for over 15 years. I stand by our products. It is clear to me that Balboas growth has weakened their ability to do a good job. You cant operate a $14 or $15 million-dollar company like a mom & pop operation. They were an accident waiting to happen.
In thinking about the interviews, you recognize that many of the comments relate to liability rather than damages; however, this is often the nature of interviews. Your job is to find information that is useful for your damage calculations and leave establishment of liability to the court.
Prepare a Commercial Damages Report
As a forensic accounting expert, you are preparing an independent analysis of damages. You have obtained financial statements for Balboa Security Systems, Inc. for the last five years for use in your analysis (see Schedule 1 that follows). Your report should be dated October 15, 2015, and addressed to Balboas attorney, Laurel Zander, Esq. You should be prepared to testify in court should the need arise. Your report should include a brief summary of the background of the case and an analysis of damages, including details regarding the following areas:
Lost profits (including loss of reputation)
Warranty costs
Advertising costs
Inventory losses
After reviewing Balboas financial information, you have decided to use the but for method of estimating damages. The but for method is based upon a market model or a sales projection designed to compute lost profits. The information you have received, when combined with the interviews, allows a reliable estimate of revenue and expenses. A 7% interest rate is appropriate for pre-trial damages. For post-trial damages, assessment of the Company indicates an 8% discount rate to be appropriate.
Trial Date: November 2, 2015
Attorney Name and Address:
Laurel Zander, Esq.
Vickers, Bolt and Zander Law
2315 1st Avenue, Suite. 1120
San Diego, CA 92101
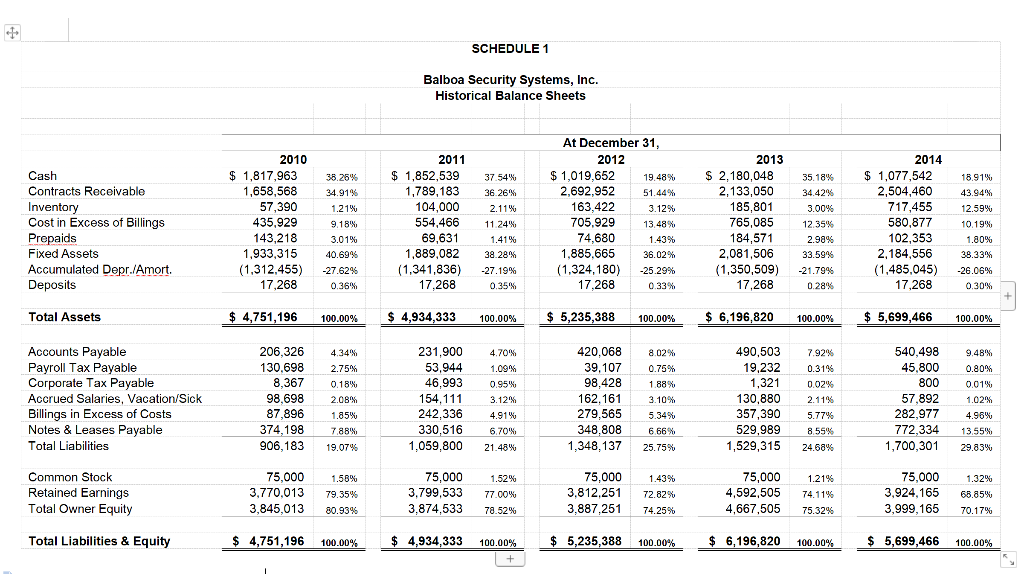
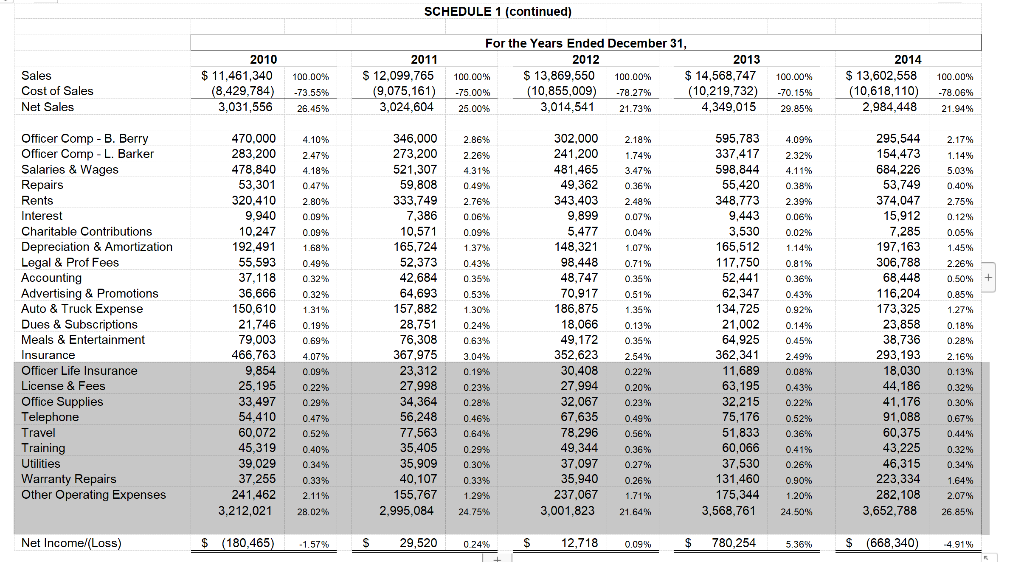
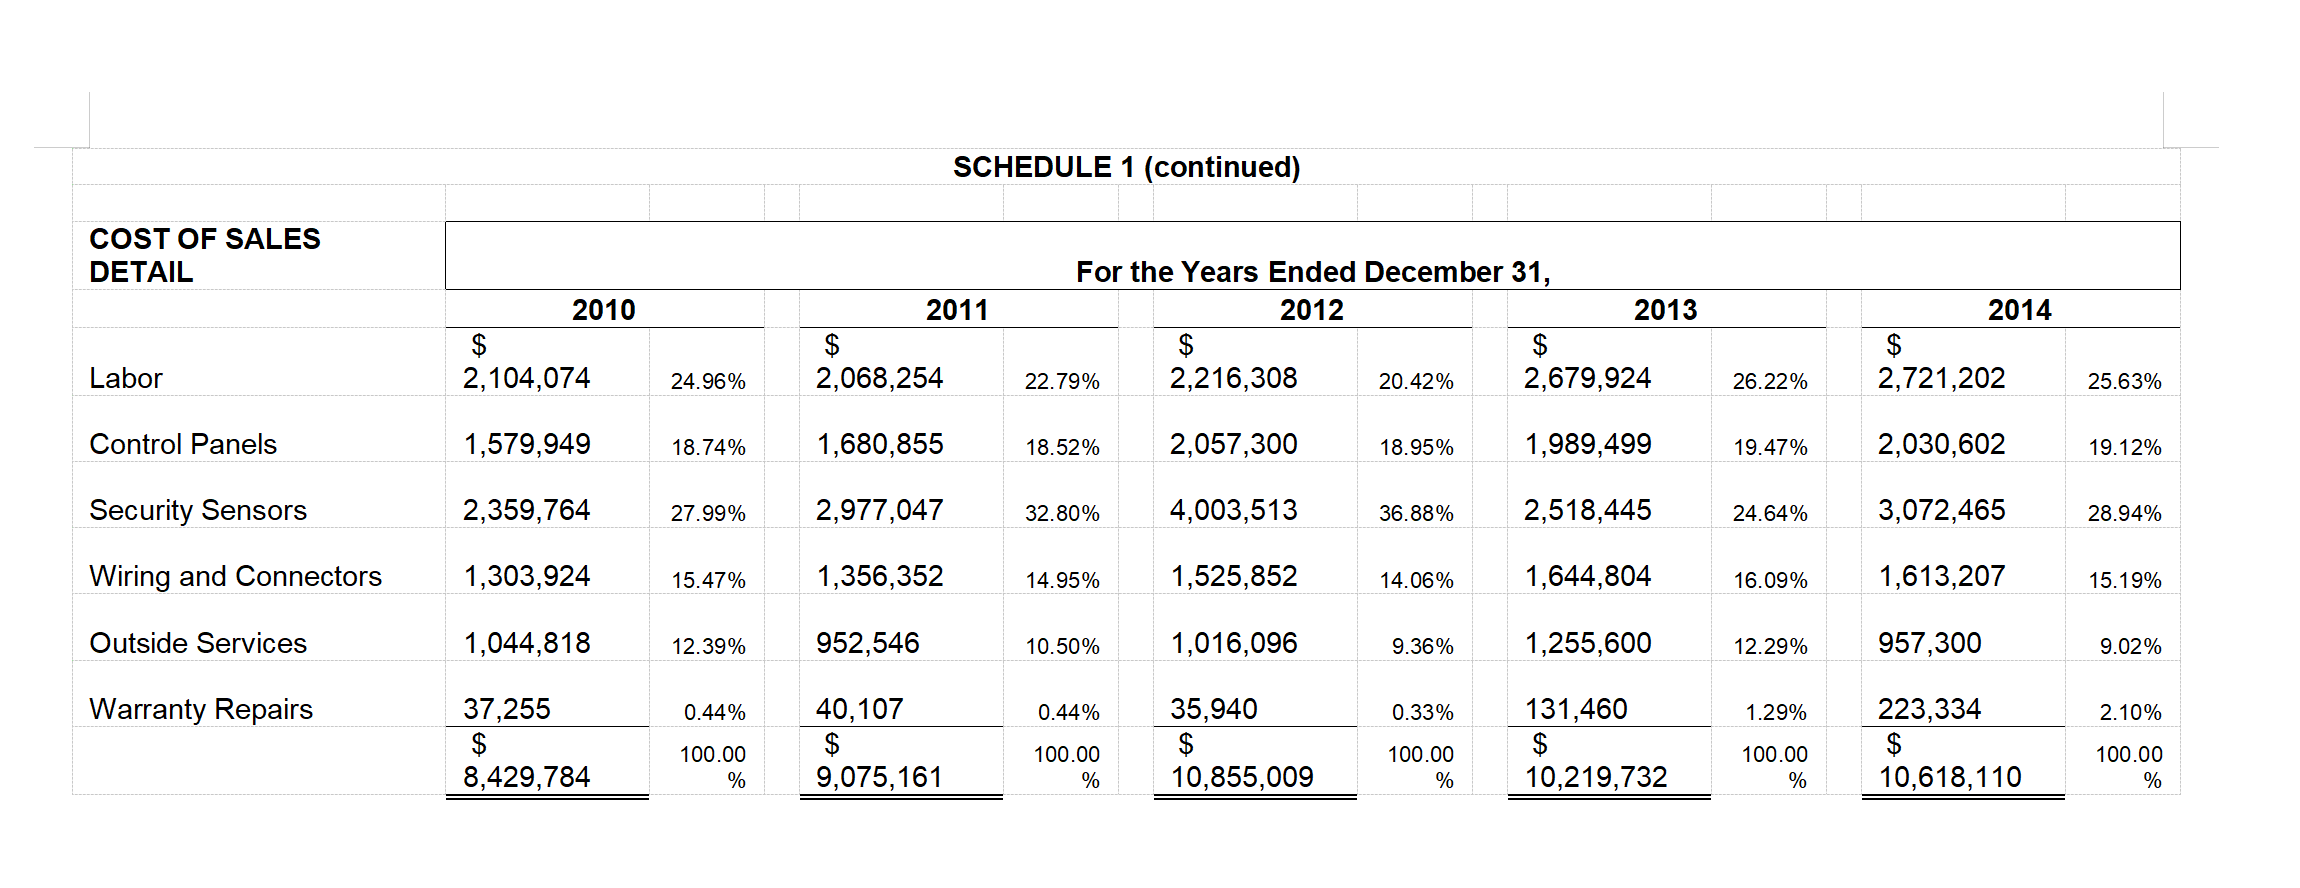
SCHEDULE 1 Balboa Security Systems, Inc. Historical Balance Sheets Cash Contracts Receivable Inventory Cost in Excess of Billings Prepaids Fixed Assets Accumulated Depr./Amort. Deposits 2010 $ 1,817,963 1,658,568 57,390 435,929 143,218 1,933,315 (1,312,455) 17,268 38.26% 34.91% 1.21% 9.18% 3.01% 40.69% -27.6295 0.36% 2011 $ 1,852,539 1,789,183 104,000 554,466 69,631 1,889,082 (1,341,836) 17.268 37.54% 36.26% 2.11% 11.24% 1.41% 38.28% -27.19% 0.35% % At December 31, 2012 $ 1,019,652 19.48% 2.692.952 51.44% 163,422 3.12% 705.929 13.48% 74,680 1.43% 1,885,665 36.02% (1,324,180) -25.29% 17,268 0.33% 2013 $ 2,180,048 2,133,050 185,801 765,085 184,571 2,081,506 (1,350,509) 17,268 35.18% 34.42% 3.00% 12.35% 2.989 33.59% -21.7996 0.28% 2014 $ 1,077,542 2,504,460 717,455 580,877 102,353 2,184,556 (1,485,045) 17,268 18.91% 43.94% 12.59% 10.19% 1.80% % 38.33% -26.06% 0.30 Total Assets $ 4,751,196 100.00% $ 4,934,333 100.00% $ 5,235,388 100.00% $ 6,196,820 100.00% $ 5,699,466 100.00% 4.34% 2.75% 0.18% Accounts Payable Payroll Tax Payable Corporate Tax Payable Accrued Salaries, Vacation/Sick Billings in Excess of Costs Notes & Leases Payable Total Liabilities 206,326 130,698 8.367 98.698 87,896 374,198 906,183 231,900 53,944 46,993 154,111 242,336 330,516 1,059,800 4.70 1.09% 0.95% 3.12% 4.91% 6.70% 2.08% 420,068 39,107 98,428 162.161 279,565 348,808 1,348,137 8.02% 0.75% 1.88% 3.10% 490,503 19,232 1,321 130,880 357,390 529,989 1,529,315 7.92% 0.31% 0.02% 2.11% 5.77% 8.55% 24.68% 540,498 45,800 800 57,892 282,977 772,334 1,700,301 9.48%. 0.80% 0.01% 1.02% 1.2m 4.96% 13,55% 29.83% 1.85% 7,88% 19.07% 5.34% 6.66% 25.75% 21.48% Common Stock Retained Earnings Total Owner Equity 75,000 3,770,013 3,845,013 1.58% 79.35% 80.93% 75,000 3.799,533 3,874,533 1.52% 77.00% 78.52% 75,000 3,812,251 3,887,251 1.43% 72.82% 74.25% 75,000 4,592,505 4,667,505 1.21% 74.11% 75.32% 75,000 3,924,165 3,999,165 1.32% 65.85% 70.17% Total Liabilities & Equity $ 4,751,196 100.00% $ 4,934,333 100.00% $ 5,235,388 100.00% $ 6,196,820 100.00% $ 5,699,466 100.00% + SCHEDULE 1 (continued) Sales Cost of Sales Net Sales 2010 $ 11,461,340 (8,429,784) 3,031,556 100.00% -73.55% 26.45% 2011 $ 12,099.765 (9,075,161) 3,024,604 For the Years Ended December 31, 2012 2013 100.00% $ 13,869,550 100.00 $ 14,568,747 -75.00% (10,855,009) -78.27% (10,219,732) 25.00% 3,014,541 21.73% 4,349,015 100.00% -70.15% 29.85% 2014 $ 13,602,558 (10,618,110) 2,984,448 100.00% -78.06% 21.94% 4.10% 2.47% Officer Comp - B. Berry Officer Comp - L. Barker Salaries & Wages Repairs 346,000 273,200 521,307 59,808 333,749 7,386 4.18% 0.47% 2001 2.80% 0.09% 0.09% 1.68% Rents 10,571 0.49% 470.000 283,200 478.840 53,301 320.410 9,940 10.247 192.491 55,593 37.118 36.666 150,610 21,746 79,003 466,763 9,854 25,195 33,497 54,410 60,072 45,319 39.029 37,255 241.462 3.212,021 Interest Charitable Contributions Depreciation & Amortization Legal & Prof Fees Accounting Advertising & Promotions Auto & Truck Expense Dues & Subscriptions Meals & Entertainment Insurance Officer Life Insurance License & Fees Office Supplies Telephone Travel Training Utilities Warranty Repairs Other Operating Expenses 0.32% 0.32% 1.31% 0.19% 100 0.69% 2.86% 2.2695 4.31% 0.49% 20 2.76% 0.06% 0.09% 1.37% 0.4396 0.35% 0.5396 1.30% 0.24% 0.63% 3.04% 0.19% 0.23% 0.28% 0.46% 0.64% % 0.29% 0.30% 0.33% 1.29% 24.75% 302.000 241,200 481,465 49,362 343,403 9.899 9.099 5,477 148,321 98,448 48,747 70,917 186,875 18,066 49,172 352,623 30,408 27,994 32,067 67,635 78,296 165,724 52,373 42,684 64,693 157,882 28,751 76,308 367,975 23,312 27,998 34,364 56,248 77,563 35,405 35,909 40,107 155,767 2,995,084 2.18% 1.74% 3.47% 0.36% 400 2.48% 0.07% 0.04% 1.07% Turm 0.71% 0.35% 0.51% 1.35% 0.13% 0.35% 2.54% 0.22% 0.20% 0.23% 0.49% 0.56% 0.36% 0.27% 0.26% 1.71 21.64 595,783 337,417 598,844 55,420 348,773 9.443 2.74 3,530 165,512 117,750 52,441 62,347 134,725 21,002 64,925 362,341 11,689 63,195 32,215 75, 176 51,833 60,066 37,530 131,460 175,344 3,568,761 4.09% 2.32% 4.11% 0.38% 2.39% 0.06% 0.02% 1.14% 0.81% 0.36% 0.43% w 0.92% 0.14% 0.45% 2.49% 0.08% 0.43% 0.22% 0.52% 0.36% 0.41% 0.26% 0.90% 295,544 154,473 684,226 53,749 374,047 15,912 7,285 197.163 306,788 68,448 116,204 173,325 23,858 38,736 293,193 40 18,030 44,186 41,176 91.088 60,375 43,225 46,315 223,334 282, 108 3,652,788 2.17% 1.14% 5.03% 0.40%) 760 2.75% 0.12% 0.05% 1.45% 2.26% 0.50 + 0.85% ce 1.27% 0.18% 0.28% 2.16% 0.13% 0.32% 0.30% 0.67% 0.44% 0.32% 0.34% 1.64% 2.07% 26.85% 4.07% 0.09% 0.22% 0.29% 0.47% 0.52% 0.40% 49,344 0.34% 0.33% 2.11% 37,097 35,940 237,067 3,001,823 1.20% 28.02% 24.50% Net Income/(Loss) $ (180,465) -1.57% S 29,520 0.24% $ 12,718 0.09% $ 780,254 5.36% $ (668,340) 4.91W SCHEDULE 1 Balboa Security Systems, Inc. Historical Balance Sheets Cash Contracts Receivable Inventory Cost in Excess of Billings Prepaids Fixed Assets Accumulated Depr./Amort. Deposits 2010 $ 1,817,963 1,658,568 57,390 435,929 143,218 1,933,315 (1,312,455) 17,268 38.26% 34.91% 1.21% 9.18% 3.01% 40.69% -27.6295 0.36% 2011 $ 1,852,539 1,789,183 104,000 554,466 69,631 1,889,082 (1,341,836) 17.268 37.54% 36.26% 2.11% 11.24% 1.41% 38.28% -27.19% 0.35% % At December 31, 2012 $ 1,019,652 19.48% 2.692.952 51.44% 163,422 3.12% 705.929 13.48% 74,680 1.43% 1,885,665 36.02% (1,324,180) -25.29% 17,268 0.33% 2013 $ 2,180,048 2,133,050 185,801 765,085 184,571 2,081,506 (1,350,509) 17,268 35.18% 34.42% 3.00% 12.35% 2.989 33.59% -21.7996 0.28% 2014 $ 1,077,542 2,504,460 717,455 580,877 102,353 2,184,556 (1,485,045) 17,268 18.91% 43.94% 12.59% 10.19% 1.80% % 38.33% -26.06% 0.30 Total Assets $ 4,751,196 100.00% $ 4,934,333 100.00% $ 5,235,388 100.00% $ 6,196,820 100.00% $ 5,699,466 100.00% 4.34% 2.75% 0.18% Accounts Payable Payroll Tax Payable Corporate Tax Payable Accrued Salaries, Vacation/Sick Billings in Excess of Costs Notes & Leases Payable Total Liabilities 206,326 130,698 8.367 98.698 87,896 374,198 906,183 231,900 53,944 46,993 154,111 242,336 330,516 1,059,800 4.70 1.09% 0.95% 3.12% 4.91% 6.70% 2.08% 420,068 39,107 98,428 162.161 279,565 348,808 1,348,137 8.02% 0.75% 1.88% 3.10% 490,503 19,232 1,321 130,880 357,390 529,989 1,529,315 7.92% 0.31% 0.02% 2.11% 5.77% 8.55% 24.68% 540,498 45,800 800 57,892 282,977 772,334 1,700,301 9.48%. 0.80% 0.01% 1.02% 1.2m 4.96% 13,55% 29.83% 1.85% 7,88% 19.07% 5.34% 6.66% 25.75% 21.48% Common Stock Retained Earnings Total Owner Equity 75,000 3,770,013 3,845,013 1.58% 79.35% 80.93% 75,000 3.799,533 3,874,533 1.52% 77.00% 78.52% 75,000 3,812,251 3,887,251 1.43% 72.82% 74.25% 75,000 4,592,505 4,667,505 1.21% 74.11% 75.32% 75,000 3,924,165 3,999,165 1.32% 65.85% 70.17% Total Liabilities & Equity $ 4,751,196 100.00% $ 4,934,333 100.00% $ 5,235,388 100.00% $ 6,196,820 100.00% $ 5,699,466 100.00% + SCHEDULE 1 (continued) Sales Cost of Sales Net Sales 2010 $ 11,461,340 (8,429,784) 3,031,556 100.00% -73.55% 26.45% 2011 $ 12,099.765 (9,075,161) 3,024,604 For the Years Ended December 31, 2012 2013 100.00% $ 13,869,550 100.00 $ 14,568,747 -75.00% (10,855,009) -78.27% (10,219,732) 25.00% 3,014,541 21.73% 4,349,015 100.00% -70.15% 29.85% 2014 $ 13,602,558 (10,618,110) 2,984,448 100.00% -78.06% 21.94% 4.10% 2.47% Officer Comp - B. Berry Officer Comp - L. Barker Salaries & Wages Repairs 346,000 273,200 521,307 59,808 333,749 7,386 4.18% 0.47% 2001 2.80% 0.09% 0.09% 1.68% Rents 10,571 0.49% 470.000 283,200 478.840 53,301 320.410 9,940 10.247 192.491 55,593 37.118 36.666 150,610 21,746 79,003 466,763 9,854 25,195 33,497 54,410 60,072 45,319 39.029 37,255 241.462 3.212,021 Interest Charitable Contributions Depreciation & Amortization Legal & Prof Fees Accounting Advertising & Promotions Auto & Truck Expense Dues & Subscriptions Meals & Entertainment Insurance Officer Life Insurance License & Fees Office Supplies Telephone Travel Training Utilities Warranty Repairs Other Operating Expenses 0.32% 0.32% 1.31% 0.19% 100 0.69% 2.86% 2.2695 4.31% 0.49% 20 2.76% 0.06% 0.09% 1.37% 0.4396 0.35% 0.5396 1.30% 0.24% 0.63% 3.04% 0.19% 0.23% 0.28% 0.46% 0.64% % 0.29% 0.30% 0.33% 1.29% 24.75% 302.000 241,200 481,465 49,362 343,403 9.899 9.099 5,477 148,321 98,448 48,747 70,917 186,875 18,066 49,172 352,623 30,408 27,994 32,067 67,635 78,296 165,724 52,373 42,684 64,693 157,882 28,751 76,308 367,975 23,312 27,998 34,364 56,248 77,563 35,405 35,909 40,107 155,767 2,995,084 2.18% 1.74% 3.47% 0.36% 400 2.48% 0.07% 0.04% 1.07% Turm 0.71% 0.35% 0.51% 1.35% 0.13% 0.35% 2.54% 0.22% 0.20% 0.23% 0.49% 0.56% 0.36% 0.27% 0.26% 1.71 21.64 595,783 337,417 598,844 55,420 348,773 9.443 2.74 3,530 165,512 117,750 52,441 62,347 134,725 21,002 64,925 362,341 11,689 63,195 32,215 75, 176 51,833 60,066 37,530 131,460 175,344 3,568,761 4.09% 2.32% 4.11% 0.38% 2.39% 0.06% 0.02% 1.14% 0.81% 0.36% 0.43% w 0.92% 0.14% 0.45% 2.49% 0.08% 0.43% 0.22% 0.52% 0.36% 0.41% 0.26% 0.90% 295,544 154,473 684,226 53,749 374,047 15,912 7,285 197.163 306,788 68,448 116,204 173,325 23,858 38,736 293,193 40 18,030 44,186 41,176 91.088 60,375 43,225 46,315 223,334 282, 108 3,652,788 2.17% 1.14% 5.03% 0.40%) 760 2.75% 0.12% 0.05% 1.45% 2.26% 0.50 + 0.85% ce 1.27% 0.18% 0.28% 2.16% 0.13% 0.32% 0.30% 0.67% 0.44% 0.32% 0.34% 1.64% 2.07% 26.85% 4.07% 0.09% 0.22% 0.29% 0.47% 0.52% 0.40% 49,344 0.34% 0.33% 2.11% 37,097 35,940 237,067 3,001,823 1.20% 28.02% 24.50% Net Income/(Loss) $ (180,465) -1.57% S 29,520 0.24% $ 12,718 0.09% $ 780,254 5.36% $ (668,340) 4.91W
Step by Step Solution
There are 3 Steps involved in it
Step: 1

Get Instant Access to Expert-Tailored Solutions
See step-by-step solutions with expert insights and AI powered tools for academic success
Step: 2

Step: 3
Ace Your Homework with AI
Get the answers you need in no time with our AI-driven, step-by-step assistance
Get Started
Bond Markets Analysis and Strategies
Authors: Frank J.Fabozzi
9th edition
133796779, 978-0133796773