Answered step by step
Verified Expert Solution
Question
1 Approved Answer
Only need (i) & (j) which are the two last ones. Everything else was answered (see answers below the question): 1. 500 Units Produced Total
Only need (i) & (j) which are the two last ones. Everything else was answered (see answers below the question):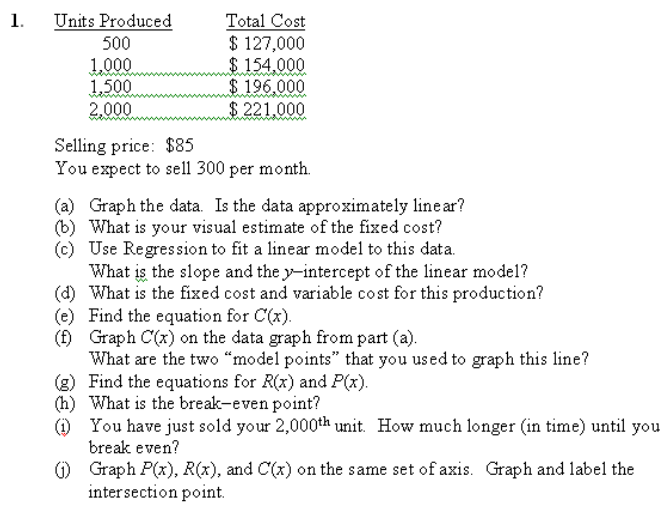
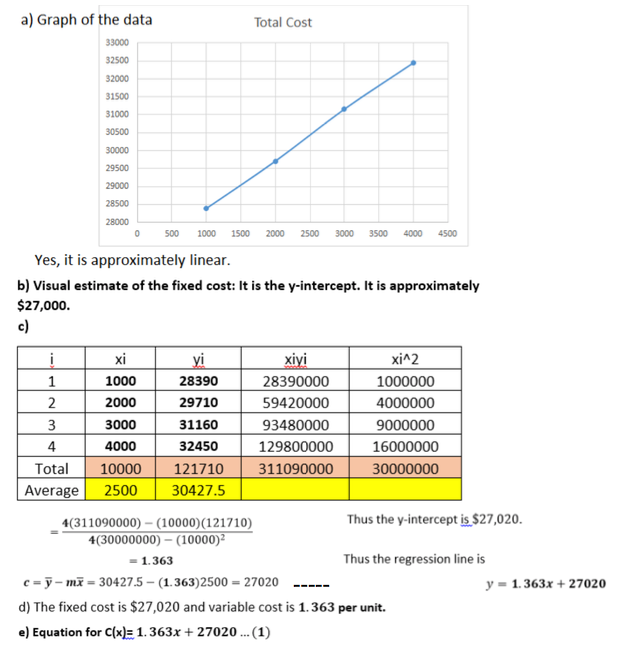
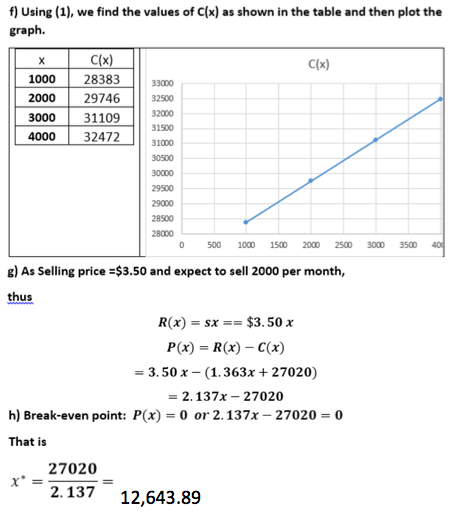
1. 500 Units Produced Total Cost $ 127,000 1,000 $ 154,000 1,500 $ 196,000 2.000...$221.000 Selling price: $85 You expect to sell 300 per month. (a) Graph the data. Is the data approximately line ar? (b) What is your visual estimate of the fixed cost? (c) Use Regression to fit a linear model to this data. What is the slope and the y-intercept of the linear model? (d) What is the fixed cost and variable cost for this production? (e) Find the equation for C'(x). (f) Graph C(x) on the data graph from part (a). What are the two "model points" that you used to graph this line? (g) Find the equations for R(x) and P(x). (h) What is the break-even point? (1) You have just sold your 2,000th unit. How much longer in time) until you break even? () Graph P(x), R(x), and C(x) on the same set of axis. Graph and label the intersection point a) Graph of the data Total Cost 33000 32500 32000 31500 31000 30500 30000 29500 29000 28500 28000 0 500 1000 1500 2000 2500 3000 3500 4000 4500 Yes, it is approximately linear. b) Visual estimate of the fixed cost: It is the y-intercept. It is approximately $27,000. wne xi yi xiyi xi^2 1000 28390 28390000 1000000 2000 29710 59420000 4000000 3000 31160 93480000 9000000 4000 32450 129800000 16000000 Total 1000012171031109000030000000 Average 2500 30427.5 4(311090000) -(10000)(121710) Thus the y-intercept is $27,020. 4(30000000) -(10000) 1.363 Thus the regression line is C-y-mx - 30427.5 -(1.363)2500 = 27020 ----- y-1.363x + 27020 d) The fixed cost is $27,020 and variable cost is 1.363 per unit. e) Equation for C(x)= 1. 363x + 27020 ... (1) f) Using (1), we find the values of C(x) as shown in the table and then plot the graph. Clx) 33000 C(x) 1000 28383 2000 29746 300031109 400032472 32000 31500 31000 30500 30000 29500 29000 28500 2000 0 500 1000 1500 2000 2500 3000 3500 40 g) As Selling price =$3.50 and expect to sell 2000 per month, thus R(x) = sx == $3.50 x P(x) = R(x) -C(x) = 3.50 x-(1.363x + 27020) = 2.137x - 27020 h) Break-even point: P(x) = 0 or 2. 137x - 27020 = 0 That is 27020 2. 137 12,643.89 1. 500 Units Produced Total Cost $ 127,000 1,000 $ 154,000 1,500 $ 196,000 2.000...$221.000 Selling price: $85 You expect to sell 300 per month. (a) Graph the data. Is the data approximately line ar? (b) What is your visual estimate of the fixed cost? (c) Use Regression to fit a linear model to this data. What is the slope and the y-intercept of the linear model? (d) What is the fixed cost and variable cost for this production? (e) Find the equation for C'(x). (f) Graph C(x) on the data graph from part (a). What are the two "model points" that you used to graph this line? (g) Find the equations for R(x) and P(x). (h) What is the break-even point? (1) You have just sold your 2,000th unit. How much longer in time) until you break even? () Graph P(x), R(x), and C(x) on the same set of axis. Graph and label the intersection point a) Graph of the data Total Cost 33000 32500 32000 31500 31000 30500 30000 29500 29000 28500 28000 0 500 1000 1500 2000 2500 3000 3500 4000 4500 Yes, it is approximately linear. b) Visual estimate of the fixed cost: It is the y-intercept. It is approximately $27,000. wne xi yi xiyi xi^2 1000 28390 28390000 1000000 2000 29710 59420000 4000000 3000 31160 93480000 9000000 4000 32450 129800000 16000000 Total 1000012171031109000030000000 Average 2500 30427.5 4(311090000) -(10000)(121710) Thus the y-intercept is $27,020. 4(30000000) -(10000) 1.363 Thus the regression line is C-y-mx - 30427.5 -(1.363)2500 = 27020 ----- y-1.363x + 27020 d) The fixed cost is $27,020 and variable cost is 1.363 per unit. e) Equation for C(x)= 1. 363x + 27020 ... (1) f) Using (1), we find the values of C(x) as shown in the table and then plot the graph. Clx) 33000 C(x) 1000 28383 2000 29746 300031109 400032472 32000 31500 31000 30500 30000 29500 29000 28500 2000 0 500 1000 1500 2000 2500 3000 3500 40 g) As Selling price =$3.50 and expect to sell 2000 per month, thus R(x) = sx == $3.50 x P(x) = R(x) -C(x) = 3.50 x-(1.363x + 27020) = 2.137x - 27020 h) Break-even point: P(x) = 0 or 2. 137x - 27020 = 0 That is 27020 2. 137 12,643.89
Step by Step Solution
There are 3 Steps involved in it
Step: 1

Get Instant Access to Expert-Tailored Solutions
See step-by-step solutions with expert insights and AI powered tools for academic success
Step: 2

Step: 3
Ace Your Homework with AI
Get the answers you need in no time with our AI-driven, step-by-step assistance
Get Started