Question
ONLY Q2 PLZ n this case you will evaluate HPCs decision on whether to introduce a new product. You should write your report from the

ONLY Q2 PLZ
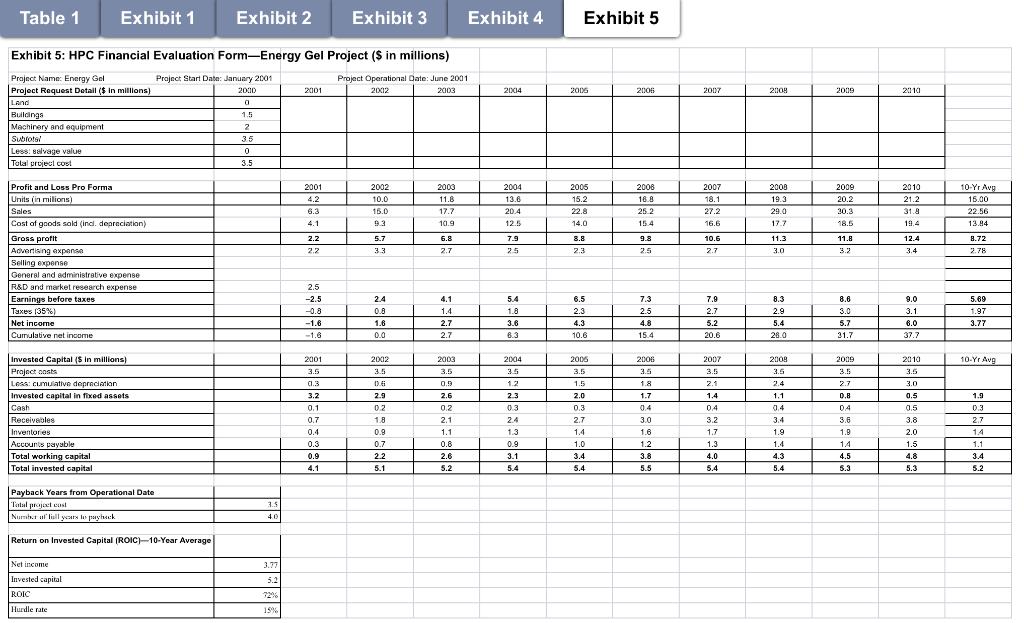
n this case you will evaluate HPCs decision on whether to introduce a new product. You should write your report from the perspective of an outside consultant that has been hired by Florence Vivar to provide advice on how to properly measure incremental FCFs and value the project. In other words, your report should not be written in the form of answers to the below questions, but instead, it should be written as a recommendation to the CFO that touches upon the below issues. In your analysis, please touch upon the following points: 1. Do you agree with Wicklers exclusion of selling expenses and G&A expenses in his estimation of expected project cash flows Exhibit 5? Why or why not? [Note: For this question, and others it is very important to explain why you recommend what you do]. 2. Where did the projected 2001 R&D expenses of $2.5 million in Exhibit 5 come from, and do you agree with Wicklers inclusion of it? Why or why not? 3. Should Wickler include potential cannibalization in his estimates and why? If so, how? 4. Do you agree with Leiters outrage that the excess capacity is being treated as free in Wicklers estimated costs, and do you agree with Nanzens recommendation of accounting for the costs of the excess capacity using a pro rata approach? Why? 5. Using your above answers, what are the incremental FCFs of the project for each year, 2000-2010, and what is the NPV of the project when you discount using the firms hurdle rate of 15%. [Note: In doing your NPV, you should assume that the assets of the project, including NWC, are liquidated at the end of 2010 and that the WACC = 15%.]
Table 1 Exhibit 1 Exhibit 2 Exhibit 3 Exhibit 4 Exhibit 5 2014 2016 2006 2007 21104 2009 2010 Land a Exhibit 5: HPC Financial Evaluation Form-Energy Gel Project (s in millions) Praject Name: Energy Gel Project Start Date: January 2001 Project Operational Date: June 2001 Project Request Detail ($ in millions) 2000 2001 20012 2003 o Buildings Machinery and equipment 2 Subtotal 35 Less: salvage value Tolal project cost 3.5 1.5 0 2001 4.2 6.3 4.1 2002 10.0 15.0 9.3 2003 11.8 17.7 10.9 2004 13.8 20.4 12.5 2005 15.2 22.8 14.0 2008 18.8 25 2 15.4 2007 18.1 27.2 16.6 TT 2008 19.3 29.0 17.7 2009 20.2 30.3 18.5 2010 21.2 31.8 19.4 10-Yr Avg 15.00 22.56 13.94 8.72 2.78 7.9 11.8 2.2 2.2 5.7 3.3 6.8 2.7 8.8 23 9.8 2.5 10.6 2.7 11.3 3.0 12.4 3.4 25 3.2 Profit and Loss Pro Forma Units in milions) Sales Cost of goods sold (incl. depreciation) Gross profit Advertising expense Selling expense General and administrative expense R&D and market research expense Earnings before taxes Taxes (35%) Net income Cumulative net income 2.5 -2.5 -0.8 -1.6 -1.8 24 0.8 1.6 0.0 4.1 1.4 2.7 2.7 5.4 1.8 3.6 8.3 6.5 2.3 4.3 10.6 7.3 2.5 4.8 15.4 7.9 2.7 5.2 20.6 8.3 2.9 5.4 28.0 8.6 3.0 5.7 31.7 9.0 3.1 6.0 37.7 5.69 1.97 3.77 2002 2003 2007 2009 2009 10-Yr Avg 2004 35 1.2 2006 3.5 3.5 2006 3.5 1.5 2010 3.5 3.5 3.5 Di 1.8 2.1 2.4 2.7 3.0 0.5 2.6 23 1.7 1.4 02 04 Invested Capital (5 in millions) Project costs LASA: cumulative depreciation Invested capital in fixed assets Cash Receiveles Inventores Accounts payable Total working capital Total invested capital 2001 3.5 01.3 3.2 0.1 0.7 0.4 0.3 0.9 4.1 1.1 0.4 34 2.9 02 1.8 0.9 0.7 22 5.1 2.1 1.1 0.8 2.6 5.2 0.3 24 1.3 0.9 3.1 5.4 2.0 0.3 2.7 1.4 1.0 3.4 5.4 3.0 1.6 1.2 3.8 5.5 04 3.2 1.7 1.3 4.0 5.4 1.9 1.4 4.3 5.4 0.8 04 3.6 1.9 1.4 4.5 5.3 0.5 0.5 3.8 2.0 1.5 4.8 5.3 1.9 0.3 2.7 1.4 1.1 3.4 5.2 Payback Years from Operational Date Tatal projectes Nurse all your lopaheck 3.5 40 Return on invested Capital (ROIC)-10-Year Average Net income Invested capital ROIC 3.17 5.2 72 Hurdle rate 19 Table 1 Exhibit 1 Exhibit 2 Exhibit 3 Exhibit 4 Exhibit 5 2014 2016 2006 2007 21104 2009 2010 Land a Exhibit 5: HPC Financial Evaluation Form-Energy Gel Project (s in millions) Praject Name: Energy Gel Project Start Date: January 2001 Project Operational Date: June 2001 Project Request Detail ($ in millions) 2000 2001 20012 2003 o Buildings Machinery and equipment 2 Subtotal 35 Less: salvage value Tolal project cost 3.5 1.5 0 2001 4.2 6.3 4.1 2002 10.0 15.0 9.3 2003 11.8 17.7 10.9 2004 13.8 20.4 12.5 2005 15.2 22.8 14.0 2008 18.8 25 2 15.4 2007 18.1 27.2 16.6 TT 2008 19.3 29.0 17.7 2009 20.2 30.3 18.5 2010 21.2 31.8 19.4 10-Yr Avg 15.00 22.56 13.94 8.72 2.78 7.9 11.8 2.2 2.2 5.7 3.3 6.8 2.7 8.8 23 9.8 2.5 10.6 2.7 11.3 3.0 12.4 3.4 25 3.2 Profit and Loss Pro Forma Units in milions) Sales Cost of goods sold (incl. depreciation) Gross profit Advertising expense Selling expense General and administrative expense R&D and market research expense Earnings before taxes Taxes (35%) Net income Cumulative net income 2.5 -2.5 -0.8 -1.6 -1.8 24 0.8 1.6 0.0 4.1 1.4 2.7 2.7 5.4 1.8 3.6 8.3 6.5 2.3 4.3 10.6 7.3 2.5 4.8 15.4 7.9 2.7 5.2 20.6 8.3 2.9 5.4 28.0 8.6 3.0 5.7 31.7 9.0 3.1 6.0 37.7 5.69 1.97 3.77 2002 2003 2007 2009 2009 10-Yr Avg 2004 35 1.2 2006 3.5 3.5 2006 3.5 1.5 2010 3.5 3.5 3.5 Di 1.8 2.1 2.4 2.7 3.0 0.5 2.6 23 1.7 1.4 02 04 Invested Capital (5 in millions) Project costs LASA: cumulative depreciation Invested capital in fixed assets Cash Receiveles Inventores Accounts payable Total working capital Total invested capital 2001 3.5 01.3 3.2 0.1 0.7 0.4 0.3 0.9 4.1 1.1 0.4 34 2.9 02 1.8 0.9 0.7 22 5.1 2.1 1.1 0.8 2.6 5.2 0.3 24 1.3 0.9 3.1 5.4 2.0 0.3 2.7 1.4 1.0 3.4 5.4 3.0 1.6 1.2 3.8 5.5 04 3.2 1.7 1.3 4.0 5.4 1.9 1.4 4.3 5.4 0.8 04 3.6 1.9 1.4 4.5 5.3 0.5 0.5 3.8 2.0 1.5 4.8 5.3 1.9 0.3 2.7 1.4 1.1 3.4 5.2 Payback Years from Operational Date Tatal projectes Nurse all your lopaheck 3.5 40 Return on invested Capital (ROIC)-10-Year Average Net income Invested capital ROIC 3.17 5.2 72 Hurdle rate 19Step by Step Solution
There are 3 Steps involved in it
Step: 1

Get Instant Access to Expert-Tailored Solutions
See step-by-step solutions with expert insights and AI powered tools for academic success
Step: 2

Step: 3

Ace Your Homework with AI
Get the answers you need in no time with our AI-driven, step-by-step assistance
Get Started


