

Answered step by step
Verified Expert Solution
Question
1 Approved Answer
****ONLY QUESTION 1 PLEASE**** this is the full data Berkshire Threaded Fasteners Company This case is set in an industrial commodities firm in New England
****ONLY QUESTION 1 PLEASE****
this is the full data
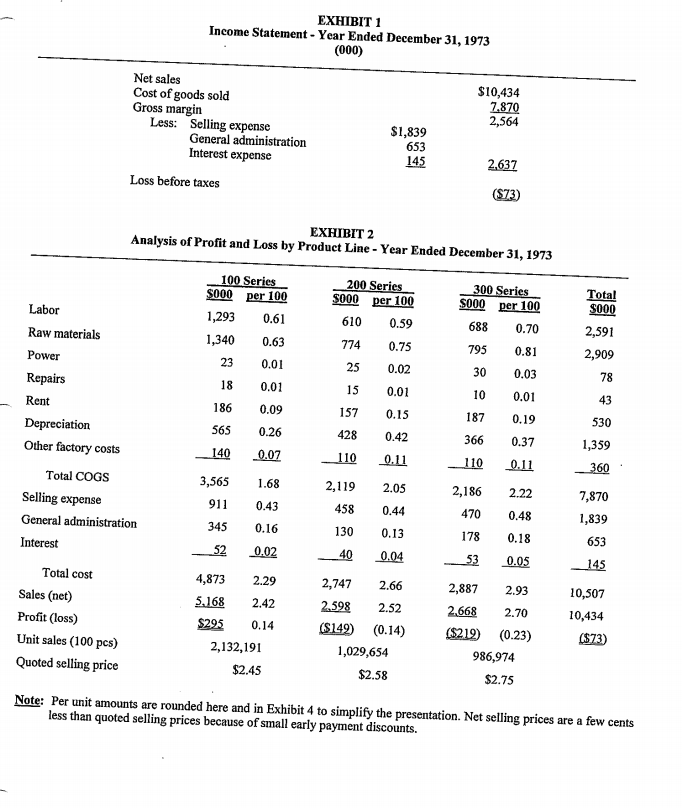
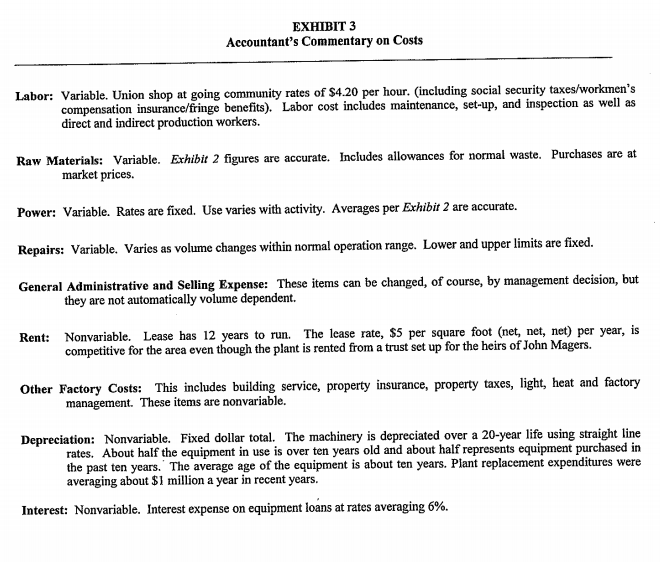
Berkshire Threaded Fasteners Company This case is set in an "industrial commodities" firm in New England in 1974, as American dominance of world markets was slipping away. The case is about basic cost analysis issues. Or, is it? In February 1973, at the age of 33, Joe Magers became president of Berkshire Threaded Fasteners Company which had been started by his father, John Magers, in 1946. Joe had only four years experience with the company. His father's untimely death in 1973 cut short their planned 10-year period of seasoning. Joe Magers knew that he had made several poor decisions during 1973 and that the morale of the organization had suffered, apparently through lack of confidence in him. When he received the income statement for 1973 (Exhibit 1), the loss of over $70,000 during a good business year convinced him that he needed help. He hired Brandon Cook, age 58, as general manager in February, 1974. Cook had extensive experience in the industry and was attracted from a competitor by a stock option incentive in addition to salary. The arrangement was that Cook would have full authority to run the company. Cook would explain the reasons for his decisions to Magers in order to train him for successful leadership upon Cook's retirement. Berkshire Threaded Fasteners Company made three lines of metal fasteners (nuts and bolts), the 100 series, the 200 series, and the 300 series. The products were sold by the company's salaried sales force throughout New England. Each sales rep sold all three lines, but in varying proportions. Berkshire was one of eight companies with similar products. Several of its competitors were larger and manufactured a larger variety of products. The dominant company was Bosworth Machining Company, which operated a plant in Berkshire's market area. Joe Magers had heard many people describe threaded fasteners as a "commodity" business. But, he had also heard a speaker say once that the term is only used by losers in a business. Berkshire's financial position was pretty solid, with $1 million in cash, 25% of sales in receivables and inventory combined, and low financial leverage. Magers did not see the current situation as "dire," but he hoped Cook could help improve long-run profitability. During 1973, Berkshire's share of industry sales in New England was 12% for the 100 series, 8% for the 200 series and 10% for the 300 series. The industry-wide quoted selling prices were $2.45, $2.58 and $2.75 per 100 pieces, respectively. Because the products of different manufacturers were very similar, Berkshire was convinced it could not individually raise prices without suffering substantial volume declines. With excess capacity for all players and very similar products, price competition was always a threat. In the past, attempts at price cutting had followed a consistent pattern. All competitors met the price reduction and the industry as a whole sold about the same quantity but at the lower prices. Demand was very "inelastic," at least in the short run, for a "derived demand" product like metal fasteners. Eventually Bosworth, with its strong financial position, would stabilize the situation following a general recognition of the failure of price cutting, Cook and Magers discussed the pricing problem. Since a sales price of $2.25 would be below cost, Magers wanted $2.45 to be continued. He felt the company could not be profitable while selling a key product line below cost. Upon taking office, Cook decided against immediate major changes. He chose instead to analyze 1973 operations and to wait for the results of the first half of 1974. He instructed the accountant to provide an earnings statement by product line for 1973 (see Exhibit 2). In addition, he requested an explanation of the nature of the costs including their expected future behavior (see Exhibit 3). To familiarize Magers with his approach to financial analysis, Cook sent him copies of these exhibits. When they discussed them, Magers stated that he thought the 300 series should be dropped immediately, as it would be impossible to lower expenses on 300s as much as 23 cents per 100 pieces. In addition, he stressed the need for cost reduction on the 200 series. Cook relied on the authority arrangement Magers had agreed to and continued production of all three lines. For control purposes, he had the accountant prepare monthly product line earnings statements comparing actual and standard performance. The accountant used the actual costs from 1973 (Exhibit 2) as the standard costs for 1974. These monthly statements were Cook's basis for making minor marketing and production changes during the spring of 1974. Late in July, 1974, Cook received the six months' statement shown here as Exhibit 4. This report showed that the first half of 1974 was a modestly successful period. It was not possible to break the variances down by product line because actual costs were only collected for the factory as a whole. In July 1974, Bosworth announced a price reduction on the 100 series from $2.45 to $2.25 per 100 pieces. This surprising move created an immediate pricing problem for Berkshire. Cook forecast that if Berkshire held to the $2.45 price during the second six months of 1974, unit sales would be 750,000 100-piece lots. He felt that if the price were dropped to $2.25, the six months' volume would be 1,000,000. Cook knew that competing managements anticipated a further decline in industry volume. QUESTIONS 1. If the company had dropped the 300 series as of January 1, 1974, what would the profit have been for the first six months of 1974? 2. In July 1974, should the company reduce the price of the 100 series from $2.45 to $2.25? Why? 3. Which is Berkshire's most profitable product line? Why? 4. What advice do you have for Mr. Magers about his business? EXHIBIT 1 Income Statement - Year Ended December 31, 1973 (000) Net sales Cost of goods sold Gross margin Less: Selling expense General administration Interest expense $10,434 7.870 2,564 $1,839 653 145 2.637 Loss before taxes (573) EXHIBIT 2 Analysis of Profit and Loss by Product Line - Year Ended December 31, 1973 300 Series S000 per 100 688 0.70 795 0.81 200 Series $000 per 100 610 0.59 774 0.75 25 0.02 Total S000 2,591 2,909 100 Series $000 per 100 1,293 0.61 1,340 0.63 23 0.01 18 0.01 186 0.09 565 0.26 140 _0.07 30 0.03 78 15 0.01 10 0.01 43 157 0.15 187 Labor Raw materials Power Repairs Rent Depreciation Other factory costs Total COGS Selling expense General administration Interest 0.19 530 428 0.42 366 0.37 1,359 110 0.11 110 0.11 360 1.68 3,565 911 2,119 2.05 2,186 2.22 0.43 458 0.44 470 0.48 345 0.16 130 178 7,870 1,839 653 145 0.18 52 0.13 0.04 0.02 40 53 0.05 2,887 2.93 2,668 Total cost Sales (net) Profit (loss) Unit sales (100 pcs) Quoted selling price 2.70 4,873 2.29 5.168 2.42 $295 0.14 2,132,191 $2.45 2,747 2.66 2.598 2.52 ($149) (0.14) 1,029,654 $2.58 10,507 10,434 ($73) ($219) (0.23) 986,974 $2.75 Note: Per unit amounts are rounded here and in Exhibit 4 to simplify the presentation. Net selling prices are a few cents less than quoted selling prices because of small early payment discounts. EXHIBIT 3 Accountant's Commentary on Costs Labor: Variable. Union shop at going community rates of $4.20 per hour. (including social security taxes/workmen's compensation insurance/fringe benefits). Labor cost includes maintenance, set-up, and inspection as well as direct and indirect production workers. Raw Materials: Variable. Exhibit 2 figures are accurate. Includes allowances for normal waste. Purchases are at market prices. Power: Variable. Rates are fixed. Use varies with activity. Averages per Exhibit 2 are accurate. Repairs: Variable. Varies as volume changes within normal operation range. Lower and upper limits are fixed. General Administrative and Selling Expense: These items can be changed, of course, by management decision, but they are not automatically volume dependent. Rent: Nonvariable. Lease has 12 years to run. The lease rate, $5 per square foot (net, net, net) per year, is competitive for the area even though the plant is rented from a trust set up for the heirs of John Magers. Other Factory Costs: This includes building service, property insurance, property taxes, light, heat and factory management. These items are nonvariable. Depreciation: Nonvariable. Fixed dollar total. The machinery is depreciated over a 20-year life using straight line rates. About half the equipment in use is over ten years old and about half represents equipment purchased in the past ten years. The average age of the equipment is about ten years. Plant replacement expenditures were averaging about $1 million a year in recent years. Interest: Nonvariable. Interest expense on equipment loans at rates averaging 6%. Berkshire Threaded Fasteners Company This case is set in an "industrial commodities" firm in New England in 1974, as American dominance of world markets was slipping away. The case is about basic cost analysis issues. Or, is it? In February 1973, at the age of 33, Joe Magers became president of Berkshire Threaded Fasteners Company which had been started by his father, John Magers, in 1946. Joe had only four years experience with the company. His father's untimely death in 1973 cut short their planned 10-year period of seasoning. Joe Magers knew that he had made several poor decisions during 1973 and that the morale of the organization had suffered, apparently through lack of confidence in him. When he received the income statement for 1973 (Exhibit 1), the loss of over $70,000 during a good business year convinced him that he needed help. He hired Brandon Cook, age 58, as general manager in February, 1974. Cook had extensive experience in the industry and was attracted from a competitor by a stock option incentive in addition to salary. The arrangement was that Cook would have full authority to run the company. Cook would explain the reasons for his decisions to Magers in order to train him for successful leadership upon Cook's retirement. Berkshire Threaded Fasteners Company made three lines of metal fasteners (nuts and bolts), the 100 series, the 200 series, and the 300 series. The products were sold by the company's salaried sales force throughout New England. Each sales rep sold all three lines, but in varying proportions. Berkshire was one of eight companies with similar products. Several of its competitors were larger and manufactured a larger variety of products. The dominant company was Bosworth Machining Company, which operated a plant in Berkshire's market area. Joe Magers had heard many people describe threaded fasteners as a "commodity" business. But, he had also heard a speaker say once that the term is only used by losers in a business. Berkshire's financial position was pretty solid, with $1 million in cash, 25% of sales in receivables and inventory combined, and low financial leverage. Magers did not see the current situation as "dire," but he hoped Cook could help improve long-run profitability. During 1973, Berkshire's share of industry sales in New England was 12% for the 100 series, 8% for the 200 series and 10% for the 300 series. The industry-wide quoted selling prices were $2.45, $2.58 and $2.75 per 100 pieces, respectively. Because the products of different manufacturers were very similar, Berkshire was convinced it could not individually raise prices without suffering substantial volume declines. With excess capacity for all players and very similar products, price competition was always a threat. In the past, attempts at price cutting had followed a consistent pattern. All competitors met the price reduction and the industry as a whole sold about the same quantity but at the lower prices. Demand was very "inelastic," at least in the short run, for a "derived demand" product like metal fasteners. Eventually Bosworth, with its strong financial position, would stabilize the situation following a general recognition of the failure of price cutting, Cook and Magers discussed the pricing problem. Since a sales price of $2.25 would be below cost, Magers wanted $2.45 to be continued. He felt the company could not be profitable while selling a key product line below cost. Upon taking office, Cook decided against immediate major changes. He chose instead to analyze 1973 operations and to wait for the results of the first half of 1974. He instructed the accountant to provide an earnings statement by product line for 1973 (see Exhibit 2). In addition, he requested an explanation of the nature of the costs including their expected future behavior (see Exhibit 3). To familiarize Magers with his approach to financial analysis, Cook sent him copies of these exhibits. When they discussed them, Magers stated that he thought the 300 series should be dropped immediately, as it would be impossible to lower expenses on 300s as much as 23 cents per 100 pieces. In addition, he stressed the need for cost reduction on the 200 series. Cook relied on the authority arrangement Magers had agreed to and continued production of all three lines. For control purposes, he had the accountant prepare monthly product line earnings statements comparing actual and standard performance. The accountant used the actual costs from 1973 (Exhibit 2) as the standard costs for 1974. These monthly statements were Cook's basis for making minor marketing and production changes during the spring of 1974. Late in July, 1974, Cook received the six months' statement shown here as Exhibit 4. This report showed that the first half of 1974 was a modestly successful period. It was not possible to break the variances down by product line because actual costs were only collected for the factory as a whole. In July 1974, Bosworth announced a price reduction on the 100 series from $2.45 to $2.25 per 100 pieces. This surprising move created an immediate pricing problem for Berkshire. Cook forecast that if Berkshire held to the $2.45 price during the second six months of 1974, unit sales would be 750,000 100-piece lots. He felt that if the price were dropped to $2.25, the six months' volume would be 1,000,000. Cook knew that competing managements anticipated a further decline in industry volume. QUESTIONS 1. If the company had dropped the 300 series as of January 1, 1974, what would the profit have been for the first six months of 1974? 2. In July 1974, should the company reduce the price of the 100 series from $2.45 to $2.25? Why? 3. Which is Berkshire's most profitable product line? Why? 4. What advice do you have for Mr. Magers about his business? EXHIBIT 1 Income Statement - Year Ended December 31, 1973 (000) Net sales Cost of goods sold Gross margin Less: Selling expense General administration Interest expense $10,434 7.870 2,564 $1,839 653 145 2.637 Loss before taxes (573) EXHIBIT 2 Analysis of Profit and Loss by Product Line - Year Ended December 31, 1973 300 Series S000 per 100 688 0.70 795 0.81 200 Series $000 per 100 610 0.59 774 0.75 25 0.02 Total S000 2,591 2,909 100 Series $000 per 100 1,293 0.61 1,340 0.63 23 0.01 18 0.01 186 0.09 565 0.26 140 _0.07 30 0.03 78 15 0.01 10 0.01 43 157 0.15 187 Labor Raw materials Power Repairs Rent Depreciation Other factory costs Total COGS Selling expense General administration Interest 0.19 530 428 0.42 366 0.37 1,359 110 0.11 110 0.11 360 1.68 3,565 911 2,119 2.05 2,186 2.22 0.43 458 0.44 470 0.48 345 0.16 130 178 7,870 1,839 653 145 0.18 52 0.13 0.04 0.02 40 53 0.05 2,887 2.93 2,668 Total cost Sales (net) Profit (loss) Unit sales (100 pcs) Quoted selling price 2.70 4,873 2.29 5.168 2.42 $295 0.14 2,132,191 $2.45 2,747 2.66 2.598 2.52 ($149) (0.14) 1,029,654 $2.58 10,507 10,434 ($73) ($219) (0.23) 986,974 $2.75 Note: Per unit amounts are rounded here and in Exhibit 4 to simplify the presentation. Net selling prices are a few cents less than quoted selling prices because of small early payment discounts. EXHIBIT 3 Accountant's Commentary on Costs Labor: Variable. Union shop at going community rates of $4.20 per hour. (including social security taxes/workmen's compensation insurance/fringe benefits). Labor cost includes maintenance, set-up, and inspection as well as direct and indirect production workers. Raw Materials: Variable. Exhibit 2 figures are accurate. Includes allowances for normal waste. Purchases are at market prices. Power: Variable. Rates are fixed. Use varies with activity. Averages per Exhibit 2 are accurate. Repairs: Variable. Varies as volume changes within normal operation range. Lower and upper limits are fixed. General Administrative and Selling Expense: These items can be changed, of course, by management decision, but they are not automatically volume dependent. Rent: Nonvariable. Lease has 12 years to run. The lease rate, $5 per square foot (net, net, net) per year, is competitive for the area even though the plant is rented from a trust set up for the heirs of John Magers. Other Factory Costs: This includes building service, property insurance, property taxes, light, heat and factory management. These items are nonvariable. Depreciation: Nonvariable. Fixed dollar total. The machinery is depreciated over a 20-year life using straight line rates. About half the equipment in use is over ten years old and about half represents equipment purchased in the past ten years. The average age of the equipment is about ten years. Plant replacement expenditures were averaging about $1 million a year in recent years. Interest: Nonvariable. Interest expense on equipment loans at rates averaging 6%Step by Step Solution
There are 3 Steps involved in it
Step: 1

Get Instant Access to Expert-Tailored Solutions
See step-by-step solutions with expert insights and AI powered tools for academic success
Step: 2

Step: 3
Ace Your Homework with AI
Get the answers you need in no time with our AI-driven, step-by-step assistance
Get Started
Crime And Punishment In The Future Internet
Authors: Sanja Milivojevic
1st Edition
036746800X, 978-0367468002