

Answered step by step
Verified Expert Solution
Question
1 Approved Answer
ONLY QUESTION 3 PLEASE Project Description: The Region_X_Property.xlsx dataset contains the following variables. List of Variables: Total Value, Land Value, # Acres Land Area, First
ONLY QUESTION 3 PLEASE 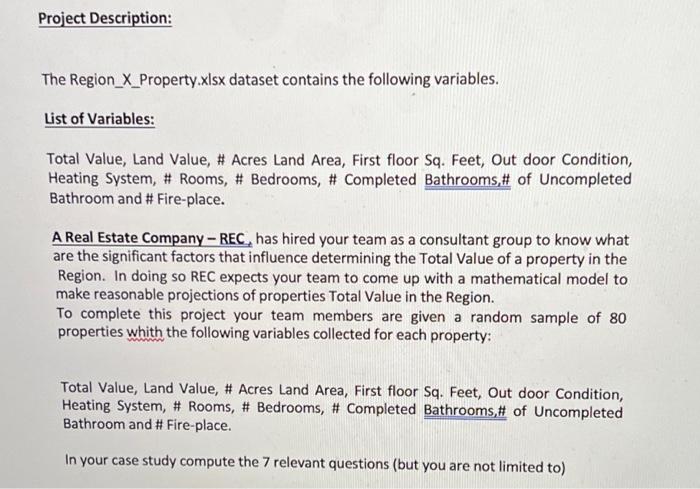
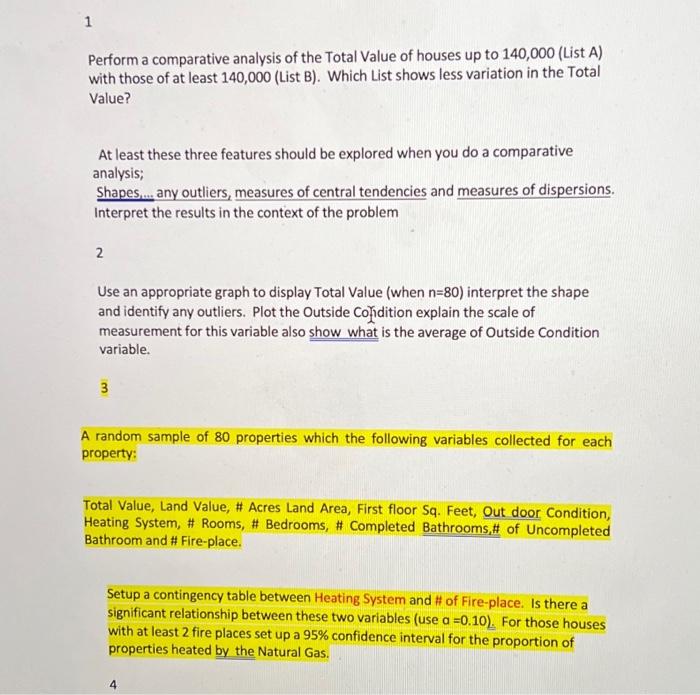
Project Description: The Region_X_Property.xlsx dataset contains the following variables. List of Variables: Total Value, Land Value, # Acres Land Area, First floor Sq. Feet, Out door Condition, Heating System, # Rooms, # Bedrooms, # Completed Bathrooms,# of Uncompleted Bathroom and #Fire-place. A Real Estate Company - REC, has hired your team as a consultant group to know what are the significant factors that influence determining the Total Value of a property in the Region. In doing so REC expects your team to come up with a mathematical model to make reasonable projections of properties Total Value in the Region. To complete this project your team members are given a random sample of 80 properties whith the following variables collected for each property: Total Value, Land Value, # Acres Land Area, First floor Sq. Feet, Out door Condition, Heating System, # Rooms, # Bedrooms, # Completed Bathrooms,# of Uncompleted Bathroom and #Fire-place. In your case study compute the 7 relevant questions (but you are not limited to) 1 Perform a comparative analysis of the Total Value of houses up to 140,000 (List A) with those of at least 140,000 (List B). Which List shows less variation in the Total Value? At least these three features should be explored when you do a comparative analysis; Shapes.... any outliers, measures of central tendencies and measures of dispersions. Interpret the results in the context of the problem 2 Use an appropriate graph to display Total Value (when n=80) interpret the shape and identify any outliers. Plot the outside Cofidition explain the scale of measurement for this variable also show what is the average of Outside Condition variable. 3 A random sample of 80 properties which the following variables collected for each property: Total Value, Land Value, # Acres Land Area, First floor Sq. Feet, Out door Condition, Heating System, # Rooms, # Bedrooms, # Completed Bathrooms,# of Uncompleted Bathroom and #Fire-place. Setup a contingency table between Heating System and # of Fire-place. Is there a significant relationship between these two variables (use a =0.10). For those houses with at least 2 fire places set up a 95% confidence interval for the proportion of properties heated by the Natural Gas. 4 Project Description: The Region_X_Property.xlsx dataset contains the following variables. List of Variables: Total Value, Land Value, # Acres Land Area, First floor Sq. Feet, Out door Condition, Heating System, # Rooms, # Bedrooms, # Completed Bathrooms,# of Uncompleted Bathroom and #Fire-place. A Real Estate Company - REC, has hired your team as a consultant group to know what are the significant factors that influence determining the Total Value of a property in the Region. In doing so REC expects your team to come up with a mathematical model to make reasonable projections of properties Total Value in the Region. To complete this project your team members are given a random sample of 80 properties whith the following variables collected for each property: Total Value, Land Value, # Acres Land Area, First floor Sq. Feet, Out door Condition, Heating System, # Rooms, # Bedrooms, # Completed Bathrooms,# of Uncompleted Bathroom and #Fire-place. In your case study compute the 7 relevant questions (but you are not limited to) 1 Perform a comparative analysis of the Total Value of houses up to 140,000 (List A) with those of at least 140,000 (List B). Which List shows less variation in the Total Value? At least these three features should be explored when you do a comparative analysis; Shapes.... any outliers, measures of central tendencies and measures of dispersions. Interpret the results in the context of the problem 2 Use an appropriate graph to display Total Value (when n=80) interpret the shape and identify any outliers. Plot the outside Cofidition explain the scale of measurement for this variable also show what is the average of Outside Condition variable. 3 A random sample of 80 properties which the following variables collected for each property: Total Value, Land Value, # Acres Land Area, First floor Sq. Feet, Out door Condition, Heating System, # Rooms, # Bedrooms, # Completed Bathrooms,# of Uncompleted Bathroom and #Fire-place. Setup a contingency table between Heating System and # of Fire-place. Is there a significant relationship between these two variables (use a =0.10). For those houses with at least 2 fire places set up a 95% confidence interval for the proportion of properties heated by the Natural Gas. 4 Step by Step Solution
There are 3 Steps involved in it
Step: 1

Get Instant Access to Expert-Tailored Solutions
See step-by-step solutions with expert insights and AI powered tools for academic success
Step: 2

Step: 3
Ace Your Homework with AI
Get the answers you need in no time with our AI-driven, step-by-step assistance
Get Started
Numerical Methods In Finance
Authors: René Carmona, Pierre Del Moral, Peng Hu, Nadia Oudjane
2012th Edition
3642257453, 978-3642257452