Answered step by step
Verified Expert Solution
Question
1 Approved Answer
OPEC crude oil imports. The data in the next table are the amounts of crude oil (millions of barrels) imported into the United States from
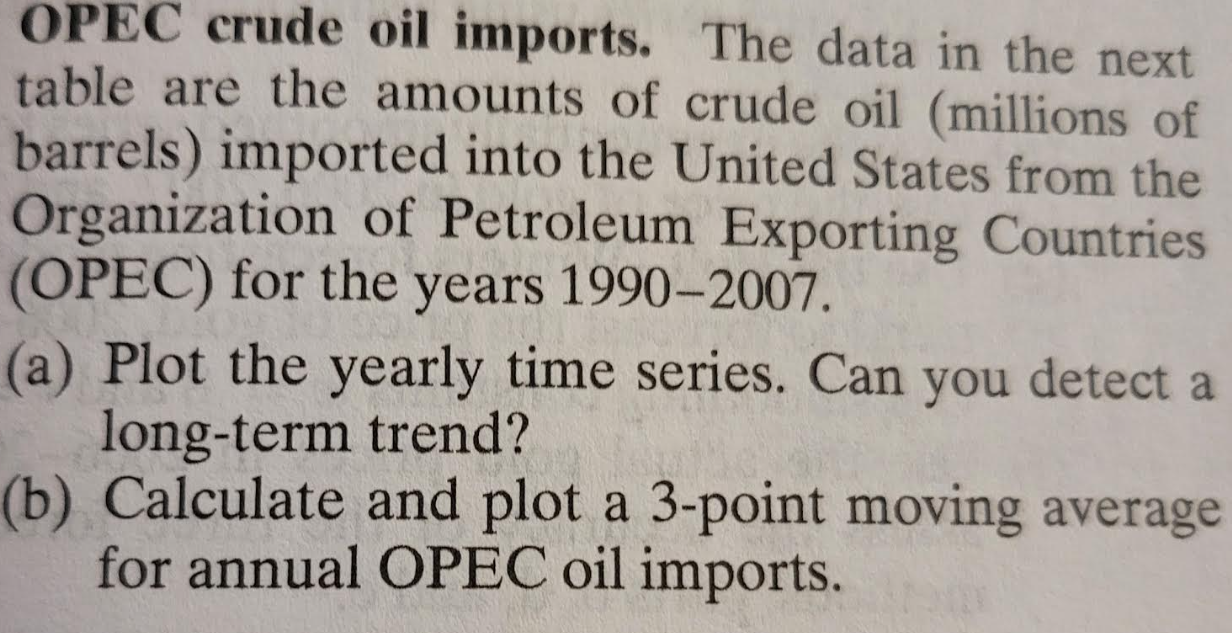
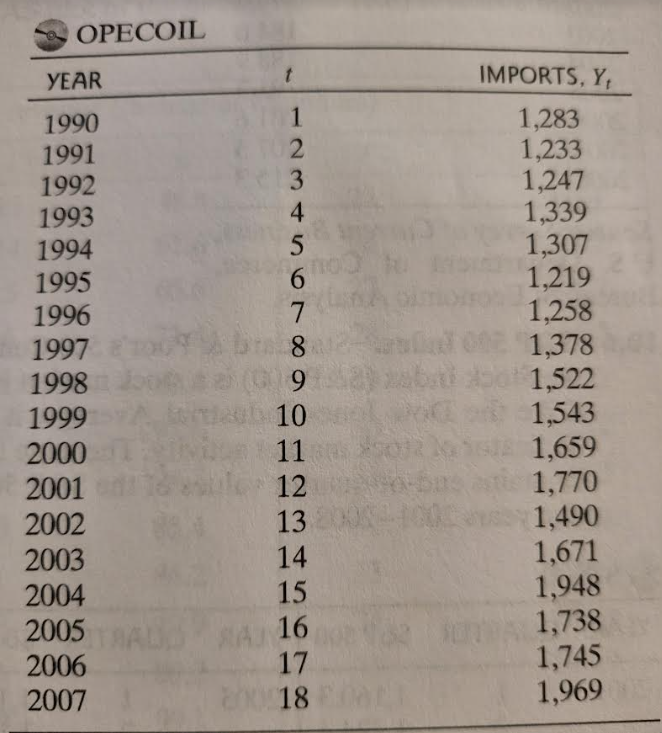
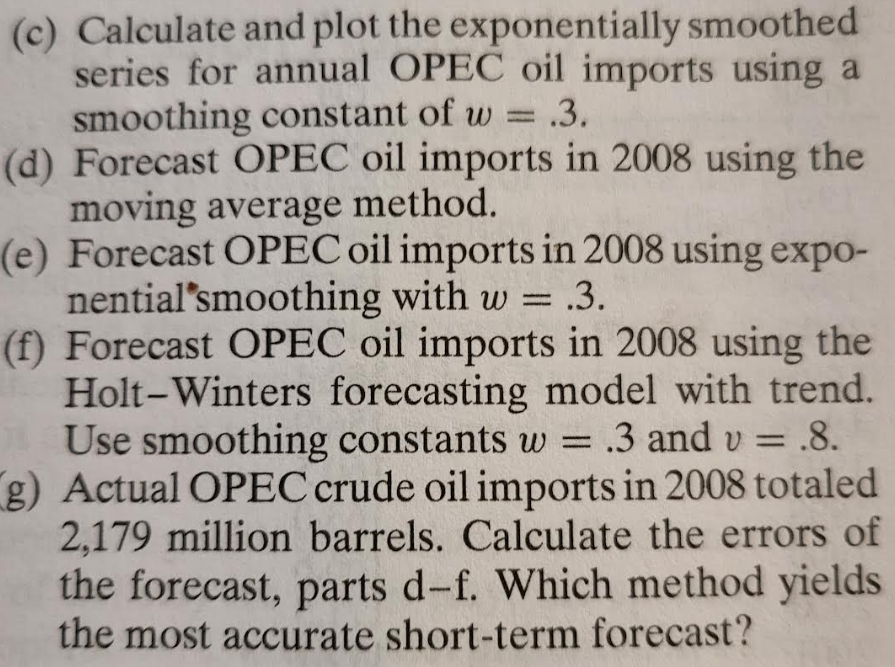
OPEC crude oil imports. The data in the next table are the amounts of crude oil (millions of barrels) imported into the United States from the Organization of Petroleum Exporting Countries (OPEC) for the years 1990-2007. (a) Plot the yearly time series. Can you detect a long-term trend? (b) Calculate and plot a 3-point moving average for annual OPEC oil imports.(c) Calculate and plot the exponentially smoothed series for annual OPEC oil imports using a smoothing constant of w = .3. (d) Forecast OPEC oil imports in 2008 using the moving average method. (e) Forecast OPEC oil imports in 2008 using expo- nential smoothing with w = .3. Forecast OPEC oil imports in 2008 using the Holt-Winters forecasting model with trend. Use smoothing constants w = .3 and v = .8. g) Actual OPEC crude oil imports in 2008 totaled 2,179 million barrels. Calculate the errors of the forecast, parts d-f. Which method yields the most accurate short-term forecast?OPECOIL YEAR IMPORTS, Y 1990 1,283 1991 1,233 1992 1,247 1993 1,339 1994 1,307 1995 1,219 1996 1,258 1997 1,378 1998 9 1,522 1999 10 1,543 2000 11 1.659 2001 12 1,770 2002 13 1,490 2003 14 1,671 2004 15 1,948 2005 16 1,738 2006 17 1,745 2007 18 1,969
Step by Step Solution
There are 3 Steps involved in it
Step: 1
Get Instant Access to Expert-Tailored Solutions
See step-by-step solutions with expert insights and AI powered tools for academic success
Step: 2
Step: 3
Ace Your Homework with AI
Get the answers you need in no time with our AI-driven, step-by-step assistance
Get Started