

Answered step by step
Verified Expert Solution
Question
1 Approved Answer
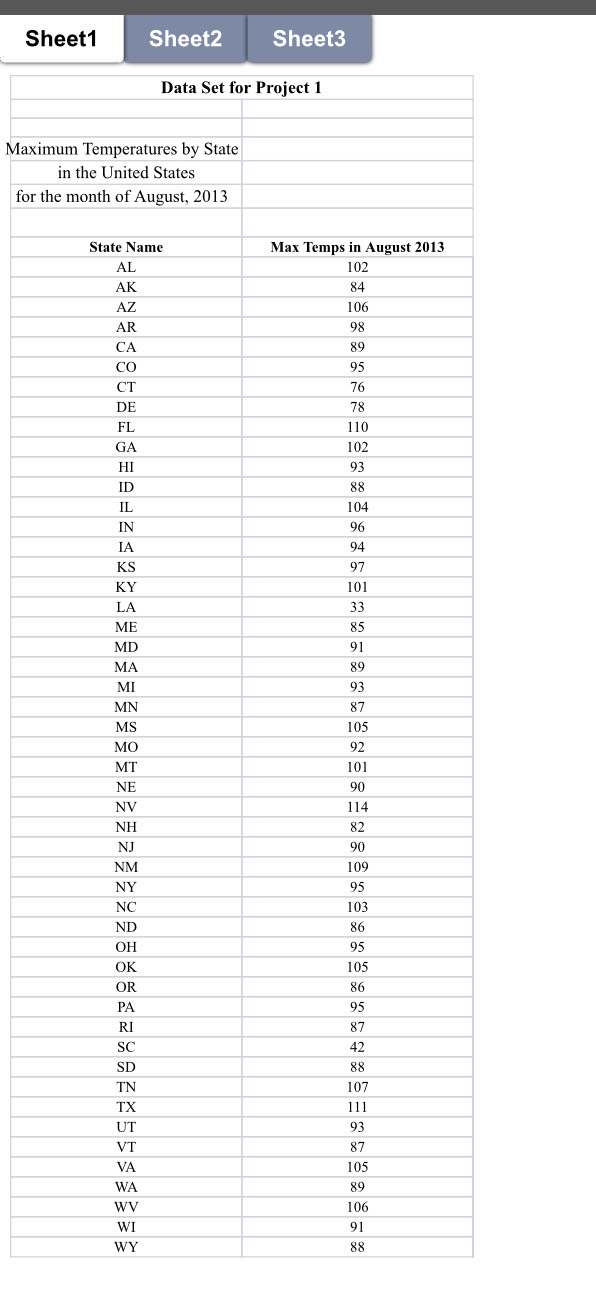
Open a blank Excel file and create grouped frequency distribution of the maximum daily temperatures for the 50 states for a 30 day period. Use
- Open a blank Excel file and create grouped frequency distribution of the maximum daily temperatures for the 50 states for a 30 day period. Use 8 classes..
- Add midpoint, relative frequency, and cumulative frequency columns to your frequency distribution
- Create frequency histogram using Excel. You will probably need to load the Data Analysis add-in within Excel.
- Ogive in Excel (or by hand).
- A. Any of the temperatures appear to be unrealistic or in error? If yes, which ones and why?B.Explain how this affects your confidence in the validity of this data set
Step by Step Solution
There are 3 Steps involved in it
Step: 1

Get Instant Access to Expert-Tailored Solutions
See step-by-step solutions with expert insights and AI powered tools for academic success
Step: 2

Step: 3
Ace Your Homework with AI
Get the answers you need in no time with our AI-driven, step-by-step assistance
Get Started
Linear Algebra
Authors: Jim Hefferon
1st Edition
978-0982406212, 0982406215