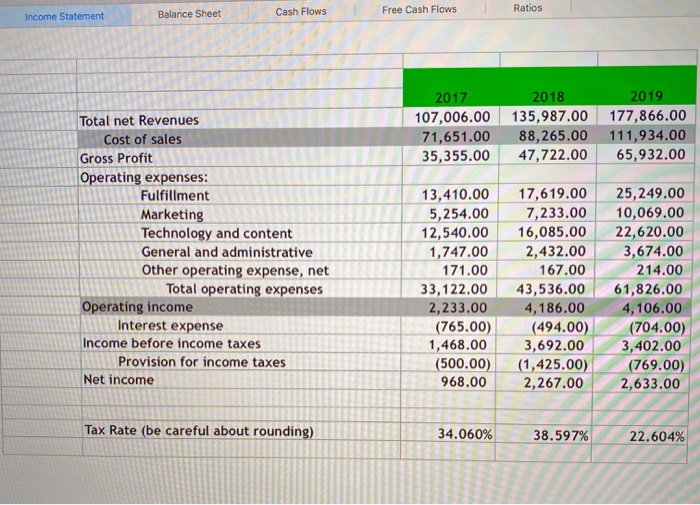
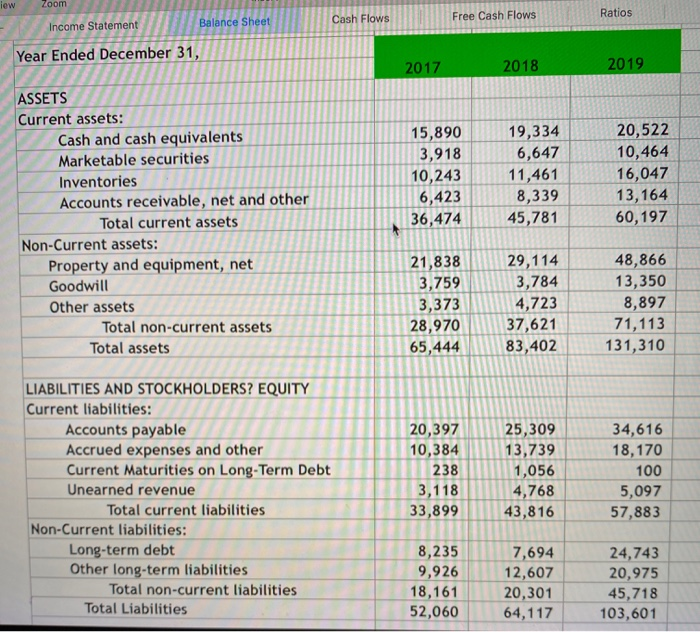
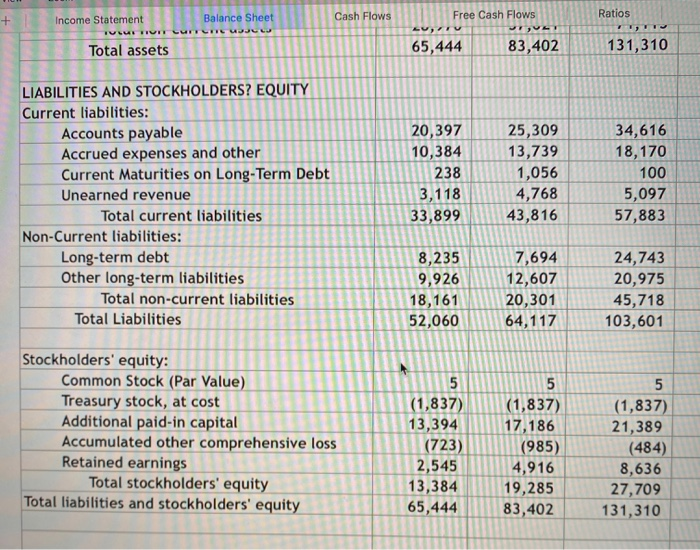
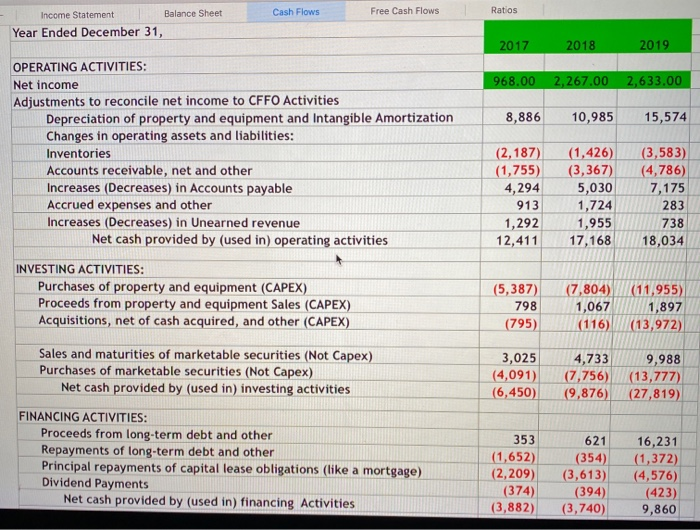
Open the linked excel file. Go to the financial statements and compute the 2019 free cash flows generated by productive assets (also called Free Cash Flow to Invested Capital). Assume that NOPAT for 2019 is $2,952.89 and round your answer to the second decimal place. Do not include the $-sign and negative numbers should be preceded with the minus sign - Ratios Income Statement Balance Sheet Cash Flows Free Cash Flows 2017 107,006.00 71,651.00 35,355.00 2018 135,987.00 88,265.00 47,722.00 2019 177,866.00 111,934.00 65,932.00 Total net Revenues Cost of sales Gross Profit Operating expenses: Fulfillment Marketing Technology and content General and administrative Other operating expense, net Total operating expenses Operating income Interest expense Income before income taxes Provision for income taxes Net income 13,410.00 5,254.00 12,540.00 1,747.00 171.00 33, 122.00 2,233.00 (765.00) 1,468.00 (500.00) 968.00 17,619.00 7,233.00 16,085.00 2,432.00 167.00 43,536.00 4,186.00 (494.00) 3,692.00 (1,425.00) 2,267.00 25,249.00 10,069.00 22,620.00 3,674.00 214.00 61,826.00 4,106.00 (704.00) 3,402.00 (769.00) 2,633.00 Tax Rate (be careful about rounding) 34.060% 38.597% 22.604% iew Zoom Ratios Free Cash Flows Cash Flows Income Statement Balance Sheet Year Ended December 31, 2017 2018 2019 ASSETS Current assets: Cash and cash equivalents Marketable securities Inventories Accounts receivable, net and other Total current assets Non-Current assets: Property and equipment, net Goodwill Other assets Total non-current assets Total assets 15,890 3,918 10,243 6,423 36,474 19,334 6,647 11,461 8,339 45,781 20,522 10,464 16,047 13,164 60,197 21,838 3,759 3,373 28,970 65,444 29,114 3,784 4,723 37,621 83,402 48,866 13,350 8,897 71,113 131,310 LIABILITIES AND STOCKHOLDERS? EQUITY Current liabilities: Accounts payable Accrued expenses and other Current Maturities on Long-Term Debt Unearned revenue Total current liabilities Non-Current liabilities: Long-term debt Other long-term liabilities Total non-current liabilities Total Liabilities 20,397 10,384 238 3,118 33,899 25,309 13,739 1,056 4,768 43,816 34,616 18,170 100 5,097 57,883 8,235 9,926 18,161 52,060 7,694 12,607 20,301 64,117 24,743 20,975 45,718 103,601 + Balance Sheet Ratios Cash Flows LU TI Income Statement TULE TUIN Total assets Free Cash Flows LUI JUE 65,444 83,402 131,310 LIABILITIES AND STOCKHOLDERS? EQUITY Current liabilities: Accounts payable Accrued expenses and other Current Maturities on Long-Term Debt Unearned revenue Total current liabilities Non-Current liabilities: Long-term debt Other long-term liabilities Total non-current liabilities Total Liabilities 20,397 10,384 238 3,118 33,899 25,309 13,739 1,056 4,768 43,816 34,616 18,170 100 5,097 57,883 8,235 9,926 18,161 52,060 7,694 12,607 20,301 64,117 24,743 20,975 45,718 103,601 Stockholders' equity: Common Stock (Par Value) Treasury stock, at cost Additional paid-in capital Accumulated other comprehensive loss Retained earnings Total stockholders' equity Total liabilities and stockholders' equity 5 (1,837) 13,394 (723) 2,545 13,384 65,444 5 (1,837) 17,186 (985) 4,916 19,285 83,402 5 (1,837) 21,389 (484) 8,636 27,709 131,310 Income Statement Balance Sheet Cash Flows Ratios Free Cash Flows Year Ended December 31, 2017 2018 2019 968.00 2,267.00 2,633.00 8,886 10,985 15,574 OPERATING ACTIVITIES: Net income Adjustments to reconcile net income to CFFO Activities Depreciation of property and equipment and Intangible Amortization Changes in operating assets and liabilities: Inventories Accounts receivable, net and other Increases (Decreases) in Accounts payable Accrued expenses and other Increases (Decreases) in Unearned revenue Net cash provided by (used in) operating activities INVESTING ACTIVITIES: Purchases of property and equipment (CAPEX) Proceeds from property and equipment Sales (CAPEX) Acquisitions, net of cash acquired, and other (CAPEX) (2,187) (1,755) 4,294 913 1,292 12,411 (1,426) (3,367) 5,030 1,724 1,955 17,168 (3,583) (4,786) 7,175 283 738 18,034 (5,387) 798 (795) (7,804) 1,067 (116) (11,955) 1,897 (13,972) 3,025 (4,091) (6,450) 4,733 (7,756) (9,876) 9,988 (13,777) (27,819) Sales and maturities of marketable securities (Not Capex) Purchases of marketable securities (Not Capex) Net cash provided by (used in) investing activities FINANCING ACTIVITIES: Proceeds from long-term debt and other Repayments of long-term debt and other Principal repayments of capital lease obligations (like a mortgage) Dividend Payments Net cash provided by (used in) financing Activities 353 (1,652) (2,209) (374) (3,882) 621 (354) (3,613) (394) (3,740) 16,231 (1,372) (4,576) (423) 9,860