Open the template file called breakeven 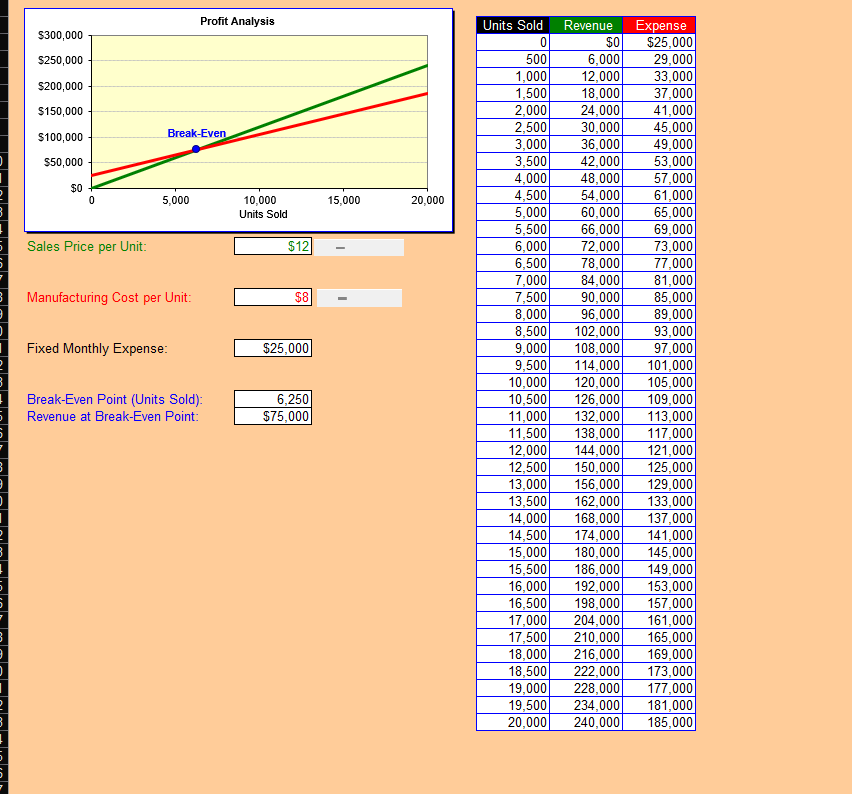 using Microsoft Excel. Examine the formulas in the file to understand the relationships between the variables (such as sales price per unit, manufacturing cost per unit, and fixed monthly expenses) and the outputs (such as break-even point and revenue at break-even point). Run at least three different scenarios, changing the inputs as desired and noting the outputs. Write a summary about the results, including screenshots of the three scenarios and your opinions on sensitivity analysis in general and in this example.
Sales Price per Unit: \begin{tabular}{|r|} \hline$12 \\ \hline \end{tabular} Break-Even Point (Units Sold): Revenue at Break-Even Point: \begin{tabular}{|r|} \hline 6,250 \\ \hline$75,000 \\ \hline \end{tabular} \begin{tabular}{|r|r|r|} \hline Units Sold & \multicolumn{1}{|r|}{ Revenue } & \multicolumn{1}{|c|}{ Expense } \\ \hline 0 & $0 & $25,000 \\ \hline 500 & 6,000 & 29,000 \\ \hline 1,000 & 12,000 & 33,000 \\ \hline 1,500 & 18,000 & 37,000 \\ \hline 2,000 & 24,000 & 41,000 \\ \hline 2,500 & 30,000 & 45,000 \\ \hline 3,000 & 36,000 & 49,000 \\ \hline 3,500 & 42,000 & 53,000 \\ \hline 4,000 & 48,000 & 57,000 \\ \hline 4,500 & 54,000 & 61,000 \\ \hline 5,000 & 60,000 & 65,000 \\ \hline 5,500 & 66,000 & 69,000 \\ \hline 6,000 & 72,000 & 73,000 \\ \hline 6,500 & 78,000 & 77,000 \\ \hline 7,000 & 84,000 & 81,000 \\ \hline 7,500 & 90,000 & 85,000 \\ \hline 8,000 & 96,000 & 89,000 \\ \hline 8,500 & 102,000 & 93,000 \\ \hline 9,000 & 108,000 & 97,000 \\ \hline 9,500 & 114,000 & 101,000 \\ \hline 10,000 & 120,000 & 105,000 \\ \hline 10,500 & 126,000 & 109,000 \\ \hline 11,000 & 132,000 & 113,000 \\ \hline 11,500 & 138,000 & 117,000 \\ \hline 12,000 & 144,000 & 121,000 \\ \hline 12,500 & 150,000 & 125,000 \\ \hline 13,000 & 156,000 & 129,000 \\ \hline 13,500 & 162,000 & 133,000 \\ \hline 14,000 & 168,000 & 137,000 \\ \hline 14,500 & 174,000 & 141,000 \\ \hline 15,000 & 180,000 & 145,000 \\ \hline 15,500 & 186,000 & 149,000 \\ \hline 16,000 & 192,000 & 153,000 \\ \hline 16,500 & 198,000 & 157,000 \\ \hline 17,000 & 204,000 & 161,000 \\ \hline 17,500 & 210,000 & 165,000 \\ \hline 18,000 & 216,000 & 169,000 \\ \hline 18,500 & 222,000 & 173,000 \\ \hline 19,000 & 228,000 & 177,000 \\ \hline 19,500 & 234,000 & 181,000 \\ \hline 20,000 & 240,000 & 185,000 \\ \hline & & \\ \hline \end{tabular} Sales Price per Unit: \begin{tabular}{|r|} \hline$12 \\ \hline \end{tabular} Break-Even Point (Units Sold): Revenue at Break-Even Point: \begin{tabular}{|r|} \hline 6,250 \\ \hline$75,000 \\ \hline \end{tabular} \begin{tabular}{|r|r|r|} \hline Units Sold & \multicolumn{1}{|r|}{ Revenue } & \multicolumn{1}{|c|}{ Expense } \\ \hline 0 & $0 & $25,000 \\ \hline 500 & 6,000 & 29,000 \\ \hline 1,000 & 12,000 & 33,000 \\ \hline 1,500 & 18,000 & 37,000 \\ \hline 2,000 & 24,000 & 41,000 \\ \hline 2,500 & 30,000 & 45,000 \\ \hline 3,000 & 36,000 & 49,000 \\ \hline 3,500 & 42,000 & 53,000 \\ \hline 4,000 & 48,000 & 57,000 \\ \hline 4,500 & 54,000 & 61,000 \\ \hline 5,000 & 60,000 & 65,000 \\ \hline 5,500 & 66,000 & 69,000 \\ \hline 6,000 & 72,000 & 73,000 \\ \hline 6,500 & 78,000 & 77,000 \\ \hline 7,000 & 84,000 & 81,000 \\ \hline 7,500 & 90,000 & 85,000 \\ \hline 8,000 & 96,000 & 89,000 \\ \hline 8,500 & 102,000 & 93,000 \\ \hline 9,000 & 108,000 & 97,000 \\ \hline 9,500 & 114,000 & 101,000 \\ \hline 10,000 & 120,000 & 105,000 \\ \hline 10,500 & 126,000 & 109,000 \\ \hline 11,000 & 132,000 & 113,000 \\ \hline 11,500 & 138,000 & 117,000 \\ \hline 12,000 & 144,000 & 121,000 \\ \hline 12,500 & 150,000 & 125,000 \\ \hline 13,000 & 156,000 & 129,000 \\ \hline 13,500 & 162,000 & 133,000 \\ \hline 14,000 & 168,000 & 137,000 \\ \hline 14,500 & 174,000 & 141,000 \\ \hline 15,000 & 180,000 & 145,000 \\ \hline 15,500 & 186,000 & 149,000 \\ \hline 16,000 & 192,000 & 153,000 \\ \hline 16,500 & 198,000 & 157,000 \\ \hline 17,000 & 204,000 & 161,000 \\ \hline 17,500 & 210,000 & 165,000 \\ \hline 18,000 & 216,000 & 169,000 \\ \hline 18,500 & 222,000 & 173,000 \\ \hline 19,000 & 228,000 & 177,000 \\ \hline 19,500 & 234,000 & 181,000 \\ \hline 20,000 & 240,000 & 185,000 \\ \hline & & \\ \hline \end{tabular}


