

Answered step by step
Verified Expert Solution
Question
1 Approved Answer
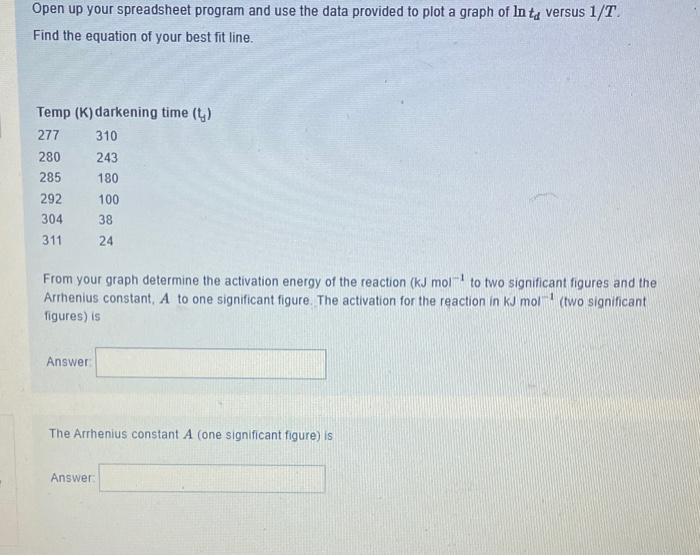
Open up your spreadsheet program and use the data provided to plot a graph of lntd versus 1/T. Find the equation of your best fit
Step by Step Solution
There are 3 Steps involved in it
Step: 1

Get Instant Access to Expert-Tailored Solutions
See step-by-step solutions with expert insights and AI powered tools for academic success
Step: 2

Step: 3
Ace Your Homework with AI
Get the answers you need in no time with our AI-driven, step-by-step assistance
Get Started
Chemistry
Authors: John E. McMurry, Robert C. Fay, Jordan Fantini
6th Edition
321704959, 978-0321704955