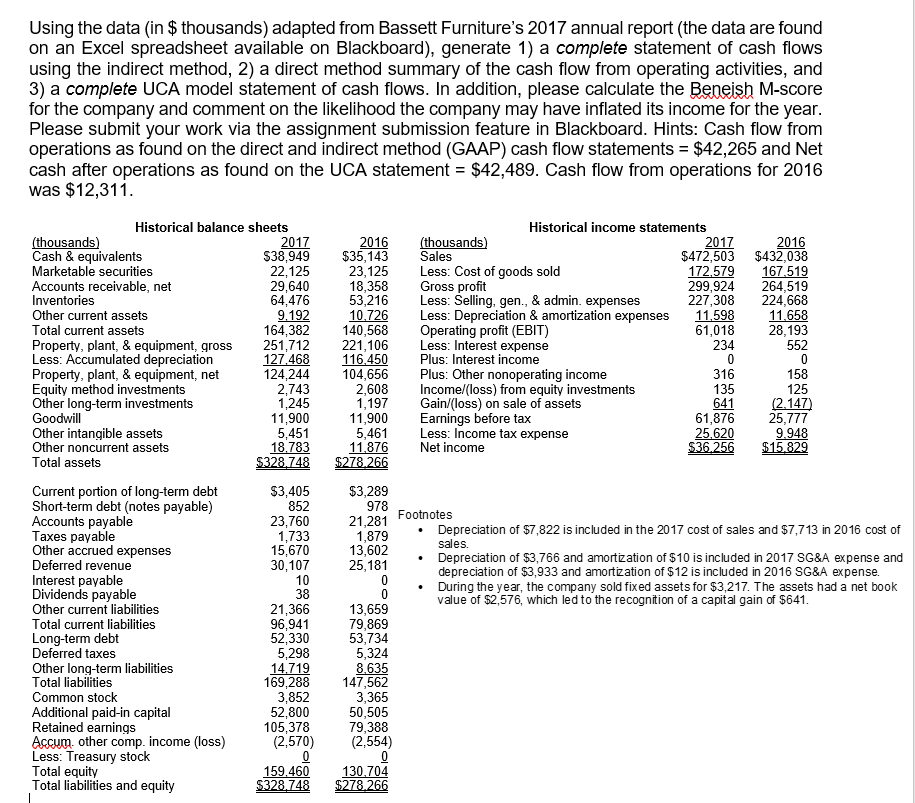
operations as fork a he assignment y may M-score cash after operations as found on the UCA statement- $42,489. Cash flow from operations for 2016 was $12,311 Using the data (in $ thousands) adapted from Bassett Furniture's 2017 annual report (the data are found on an Excel spreadsheet available on Blackboard), generate 1) a complete statement of cash flows using the indirect method, 2) a direct method summary of the cash flow from operating activities, and 3) a complete UCA model statement of cash flows. In addition, please calculate the Beneish M-score for the company and comment on the likelihood the company may have inflated its income for the year Please submit your work via the assignment submission feature in Blackboard. Hints: Cash flow from operations as found on the direct and indirect method (GAAP) cash flow statements $42,265 and Net Historical balance sheets Historical income statements 016 $472,503 $432,038 172.579 167 519 299,924 264,519 227,308 224,668 11658 28, 193 2017 (thousands) Cash & equivalents Marketable securities Accounts receivable, net Inventories Other current assets Total current assets Property, plant, & equipment, gross251,712 Less: Accumulated depreciation Property, plant, & equipment, n Equity method investments Other long-term investments Goodwil Other intangible assets Other noncurrent assets Total assets 2016 (thousands) S38,949 $35,143 Sales 22,125 29,640 64,476 23,125 Less: Cost of goods sold Gross profit Less: Selling, gen., & admin. expenses Less: Depreciation & amortization expenses 9,192 10726 221,106 104,656 11,598 164,382 140,568 Operating profit (EBIT) Less: Interest expense 552 127 468 116450 Plus: Interest income 124,244 Plus: Other nonoperating income 2,743 2,608Income/(loss) from equity investments 1,197Gain/(loss) on sale of assets 641 61,876 125 135 2147 11.900 ar 25,777 5,461 Less: Income tax expense 11876 Net income $3,405 852 23,760 1,733 Current portion of long-term debt Short-term debt (notes payable) $3,289 21,281 Footnotes 13,602 Depreciation of $7,822 is included in the 2017 cost of sales and $7,713 in 2016 cost of Taxes payable Other accrued expenses Deferred revenue Interest payable Dividends payable Other current liabilities Total current liabilities Long-term debt Deferred taxes Other long-term liabilities Total liabilities 15,670 30,107 Depreciation of $3,766 and amortization of $10 is included in 2017 SG&A expense and depreciation of $3,933 and amortization of $12 is included in 2016 SG&A expense. During the year, the company sold fixed assets for $3,217. The assets had a net book value of $2,576, which led to the recognition of a capital gain of $641 25,181 13,659 79,869 21,366 96,941 52,330 5,298 Additional paid-in capital Retained earnings Accum other comp. income (loss) Less: Treasury stock Total equity Total liabilities and equity 169,288 3,852 52,800 105,378 (2,570) 8,635 147,562 50,505 79,388 159 460 130,704 $328,748 $278 266 operations as fork a he assignment y may M-score cash after operations as found on the UCA statement- $42,489. Cash flow from operations for 2016 was $12,311 Using the data (in $ thousands) adapted from Bassett Furniture's 2017 annual report (the data are found on an Excel spreadsheet available on Blackboard), generate 1) a complete statement of cash flows using the indirect method, 2) a direct method summary of the cash flow from operating activities, and 3) a complete UCA model statement of cash flows. In addition, please calculate the Beneish M-score for the company and comment on the likelihood the company may have inflated its income for the year Please submit your work via the assignment submission feature in Blackboard. Hints: Cash flow from operations as found on the direct and indirect method (GAAP) cash flow statements $42,265 and Net Historical balance sheets Historical income statements 016 $472,503 $432,038 172.579 167 519 299,924 264,519 227,308 224,668 11658 28, 193 2017 (thousands) Cash & equivalents Marketable securities Accounts receivable, net Inventories Other current assets Total current assets Property, plant, & equipment, gross251,712 Less: Accumulated depreciation Property, plant, & equipment, n Equity method investments Other long-term investments Goodwil Other intangible assets Other noncurrent assets Total assets 2016 (thousands) S38,949 $35,143 Sales 22,125 29,640 64,476 23,125 Less: Cost of goods sold Gross profit Less: Selling, gen., & admin. expenses Less: Depreciation & amortization expenses 9,192 10726 221,106 104,656 11,598 164,382 140,568 Operating profit (EBIT) Less: Interest expense 552 127 468 116450 Plus: Interest income 124,244 Plus: Other nonoperating income 2,743 2,608Income/(loss) from equity investments 1,197Gain/(loss) on sale of assets 641 61,876 125 135 2147 11.900 ar 25,777 5,461 Less: Income tax expense 11876 Net income $3,405 852 23,760 1,733 Current portion of long-term debt Short-term debt (notes payable) $3,289 21,281 Footnotes 13,602 Depreciation of $7,822 is included in the 2017 cost of sales and $7,713 in 2016 cost of Taxes payable Other accrued expenses Deferred revenue Interest payable Dividends payable Other current liabilities Total current liabilities Long-term debt Deferred taxes Other long-term liabilities Total liabilities 15,670 30,107 Depreciation of $3,766 and amortization of $10 is included in 2017 SG&A expense and depreciation of $3,933 and amortization of $12 is included in 2016 SG&A expense. During the year, the company sold fixed assets for $3,217. The assets had a net book value of $2,576, which led to the recognition of a capital gain of $641 25,181 13,659 79,869 21,366 96,941 52,330 5,298 Additional paid-in capital Retained earnings Accum other comp. income (loss) Less: Treasury stock Total equity Total liabilities and equity 169,288 3,852 52,800 105,378 (2,570) 8,635 147,562 50,505 79,388 159 460 130,704 $328,748 $278 266