

Answered step by step
Verified Expert Solution
Question
1 Approved Answer
Option 2 If you have graphing calculators available for your class or an overhead graphing calculator available for demonstrations, conduct a data analysis activity with
Option
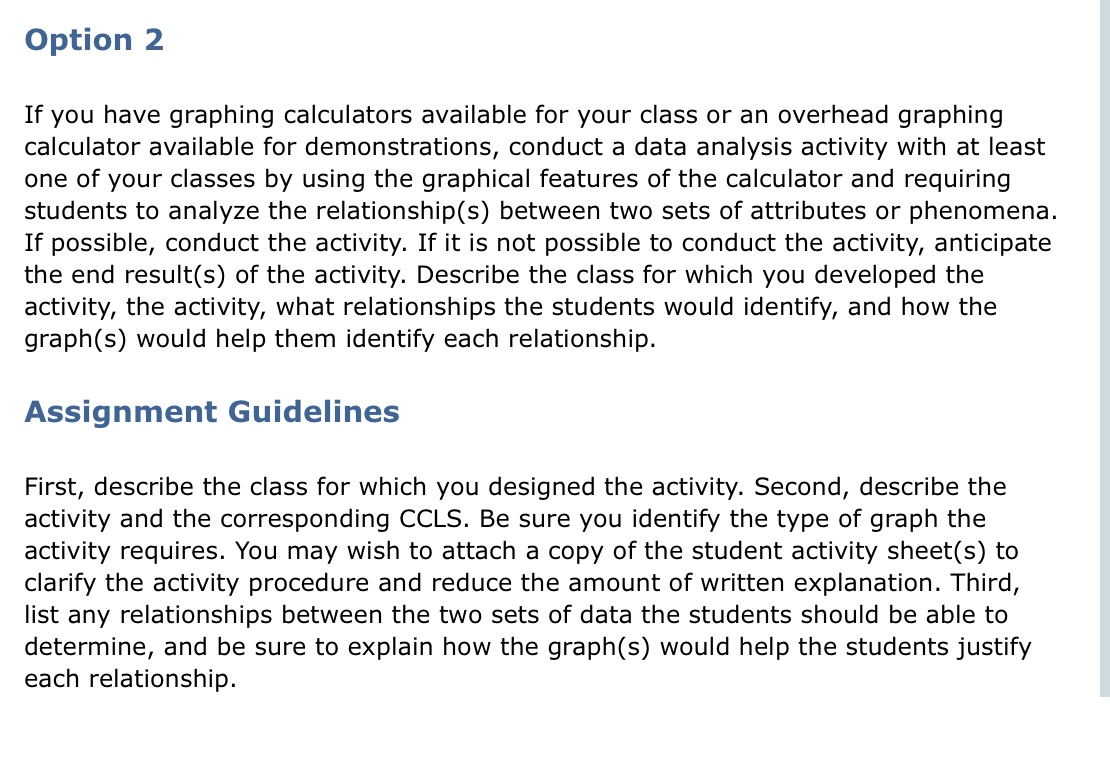
If you have graphing calculators available for your class or an overhead graphing
calculator available for demonstrations, conduct a data analysis activity with at least
one of your classes by using the graphical features of the calculator and requiring
students to analyze the relationships between two sets of attributes or phenomena.
If possible, conduct the activity. If it is not possible to conduct the activity, anticipate
the end results of the activity. Describe the class for which you developed the
activity, the activity, what relationships the students would identify, and how the
graphs would help them identify each relationship.
Assignment Guidelines
First, describe the class for which you designed the activity. Second, describe the
activity and the corresponding CCLS Be sure you identify the type of graph the
activity requires. You may wish to attach a copy of the student activity sheets to
clarify the activity procedure and reduce the amount of written explanation. Third,
list any relationships between the two sets of data the students should be able to
determine, and be sure to explain how the graphs would help the students justify
each relationship.
Step by Step Solution
There are 3 Steps involved in it
Step: 1

Get Instant Access to Expert-Tailored Solutions
See step-by-step solutions with expert insights and AI powered tools for academic success
Step: 2

Step: 3
Ace Your Homework with AI
Get the answers you need in no time with our AI-driven, step-by-step assistance
Get Started
Understanding Management
Authors: Richard L. Daft, Dorothy Marcic
5th Edition
1111580243, 1111580247, 978-0324405712