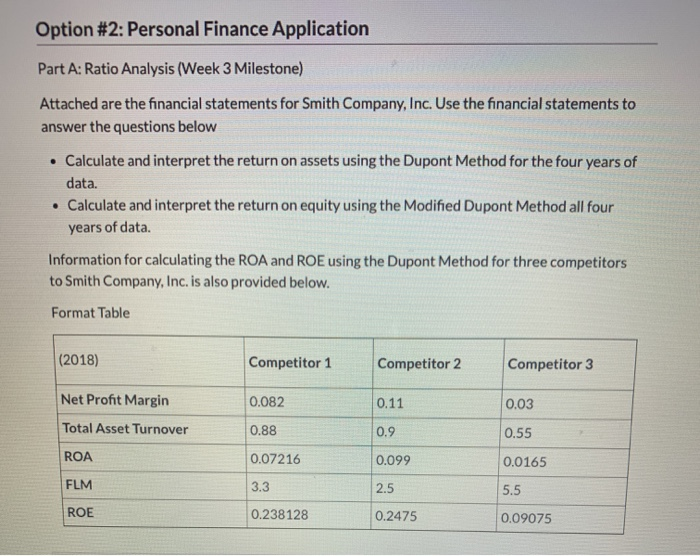
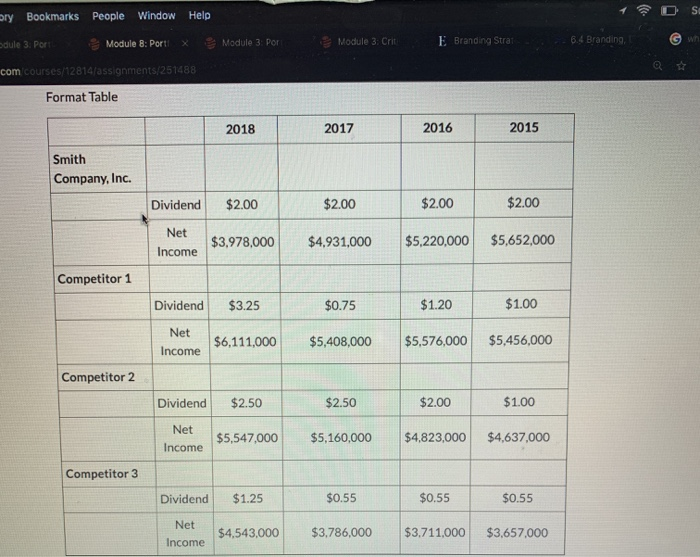
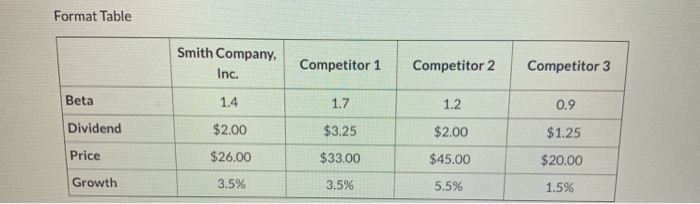
Option #2: Personal Finance Application Part A: Ratio Analysis (Week 3 Milestone) Attached are the financial statements for Smith Company, Inc. Use the financial statements to answer the questions below Calculate and interpret the return on assets using the Dupont Method for the four years of data. . Calculate and interpret the return on equity using the Modified Dupont Method all four years of data. Information for calculating the ROA and ROE using the Dupont Method for three competitors to Smith Company, Inc. is also provided below. Format Table (2018) Competitor 1 Competitor 2 Competitor 3 0.082 0.11 0.88 0.9 Net Profit Margin Total Asset Turnover ROA FLM 0.07216 0.099 0.03 0.55 0.0165 5.5 0.09075 3.3 2.5 ROE 0.238128 0.2475 pry Bookmarks People Window Help DS dule 3. Port Module 8: Porti X Module 3: Por Module 3: Crita E Branding Strat 6.4 Branding, w com courses/12814/assignments/251488 Format Table 2018 2017 2016 2015 Smith Company, Inc. Dividend $2.00 $2.00 $2.00 $2.00 Net Income $3,978,000 $4.931,000 $5,220,000 $5,652,000 Competitor 1 Dividend $3.25 $0.75 $1.20 $1.00 Net $6,111,000 $5,408,000 $5,576,000 $5,456,000 Income Competitor 2 $2.50 $2.50 $2.00 $1.00 Dividend Net Income $5,547,000 $5,160,000 $4,823,000 $4,637,000 Competitor 3 Dividend $1.25 $0.55 $0.55 $0.55 Net $4,543,000 $3,786,000 $3,711,000 $3,657,000 Income Format Table Smith Company, Inc. Competitor 1 Competitor 2 Competitor 3 1.4 1.2 0.9 Beta Dividend Price $2.00 $1.25 1.7 $3.25 $33.00 3.5% $2.00 $45.00 $26.00 $20.00 Growth 3.5% 5.5% 1.5% Option #2: Personal Finance Application Part A: Ratio Analysis (Week 3 Milestone) Attached are the financial statements for Smith Company, Inc. Use the financial statements to answer the questions below Calculate and interpret the return on assets using the Dupont Method for the four years of data. . Calculate and interpret the return on equity using the Modified Dupont Method all four years of data. Information for calculating the ROA and ROE using the Dupont Method for three competitors to Smith Company, Inc. is also provided below. Format Table (2018) Competitor 1 Competitor 2 Competitor 3 0.082 0.11 0.88 0.9 Net Profit Margin Total Asset Turnover ROA FLM 0.07216 0.099 0.03 0.55 0.0165 5.5 0.09075 3.3 2.5 ROE 0.238128 0.2475 pry Bookmarks People Window Help DS dule 3. Port Module 8: Porti X Module 3: Por Module 3: Crita E Branding Strat 6.4 Branding, w com courses/12814/assignments/251488 Format Table 2018 2017 2016 2015 Smith Company, Inc. Dividend $2.00 $2.00 $2.00 $2.00 Net Income $3,978,000 $4.931,000 $5,220,000 $5,652,000 Competitor 1 Dividend $3.25 $0.75 $1.20 $1.00 Net $6,111,000 $5,408,000 $5,576,000 $5,456,000 Income Competitor 2 $2.50 $2.50 $2.00 $1.00 Dividend Net Income $5,547,000 $5,160,000 $4,823,000 $4,637,000 Competitor 3 Dividend $1.25 $0.55 $0.55 $0.55 Net $4,543,000 $3,786,000 $3,711,000 $3,657,000 Income Format Table Smith Company, Inc. Competitor 1 Competitor 2 Competitor 3 1.4 1.2 0.9 Beta Dividend Price $2.00 $1.25 1.7 $3.25 $33.00 3.5% $2.00 $45.00 $26.00 $20.00 Growth 3.5% 5.5% 1.5%