Answered step by step
Verified Expert Solution
Link Copied!

Question

1 Approved Answer

ORG 3M 3 ACCOUNTS & FINANCE OPERATIONS MORE B Burton IBBusinessandManagement.com BREAK-EVEN ANALYSIS: Activity 5.3 B Read the case study below and answer the questions
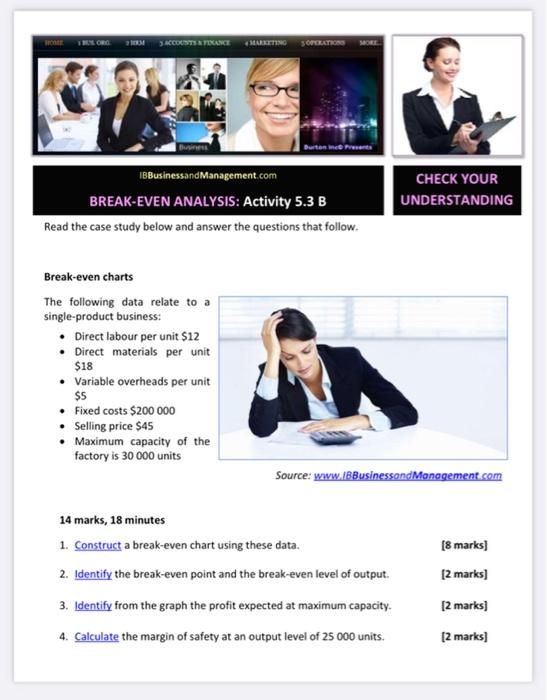
image text in transcribed
ORG 3M 3 ACCOUNTS & FINANCE OPERATIONS MORE B Burton IBBusinessandManagement.com BREAK-EVEN ANALYSIS: Activity 5.3 B Read the case study below and answer the questions that follow. CHECK YOUR UNDERSTANDING Break-even charts The following data relate to a single-product business: Direct labour per unit $12 Direct materials per unit $18 Variable overheads per unit $5 Fixed costs $200 000 Selling price $45 Maximum capacity of the factory is 30 000 units Source: www.BBusinessand Management.com [8 marks) 14 marks, 18 minutes 1. Construct a break-even chart using these data. 2. Identify the break-even point and the break-even level of output 3. Identify from the graph the profit expected at maximum capacity. 4. Calculate the margin of safety at an output level of 25 000 units. [2 marks] [2 marks] [2 marks]

Step by Step Solution

There are 3 Steps involved in it

Step: 1

blur-text-image

Get Instant Access to Expert-Tailored Solutions

See step-by-step solutions with expert insights and AI powered tools for academic success

Step: 2

blur-text-image

Step: 3

blur-text-image

Ace Your Homework with AI

Get the answers you need in no time with our AI-driven, step-by-step assistance

Get Started

Recommended Textbook for

The Geography Of Finance

Authors: Gordon L. Clark, Darius Wójcik

1st Edition

0199213364, 978-0199213368

More Books

Students also viewed these Finance questions

Question

Analyse the various techniques of training and learning.

Answered: 1 week ago