

Question
Original problem: Product development engineers and marketers at a household washing machine manufacturing firm want to determine the optimal length of time for a washing
Original problem: Product development engineers and marketers at a household washing machine manufacturing firm want to determine the optimal length of time for a washing cycle. Part of the study includes understanding the relationship between the detergent used (four brands) and the length of the washing cycle (18, 20, 22, or 24 minutes). In order to run the experiment, 32 standard household laundry loads (having equal amount of dirt and the same total weights) are randomly assigned to the 16 detergent-washing cycle combinations. The results (in pounds of dirt removed) are shown below. (Note: The higher the number, the more dirt removed).
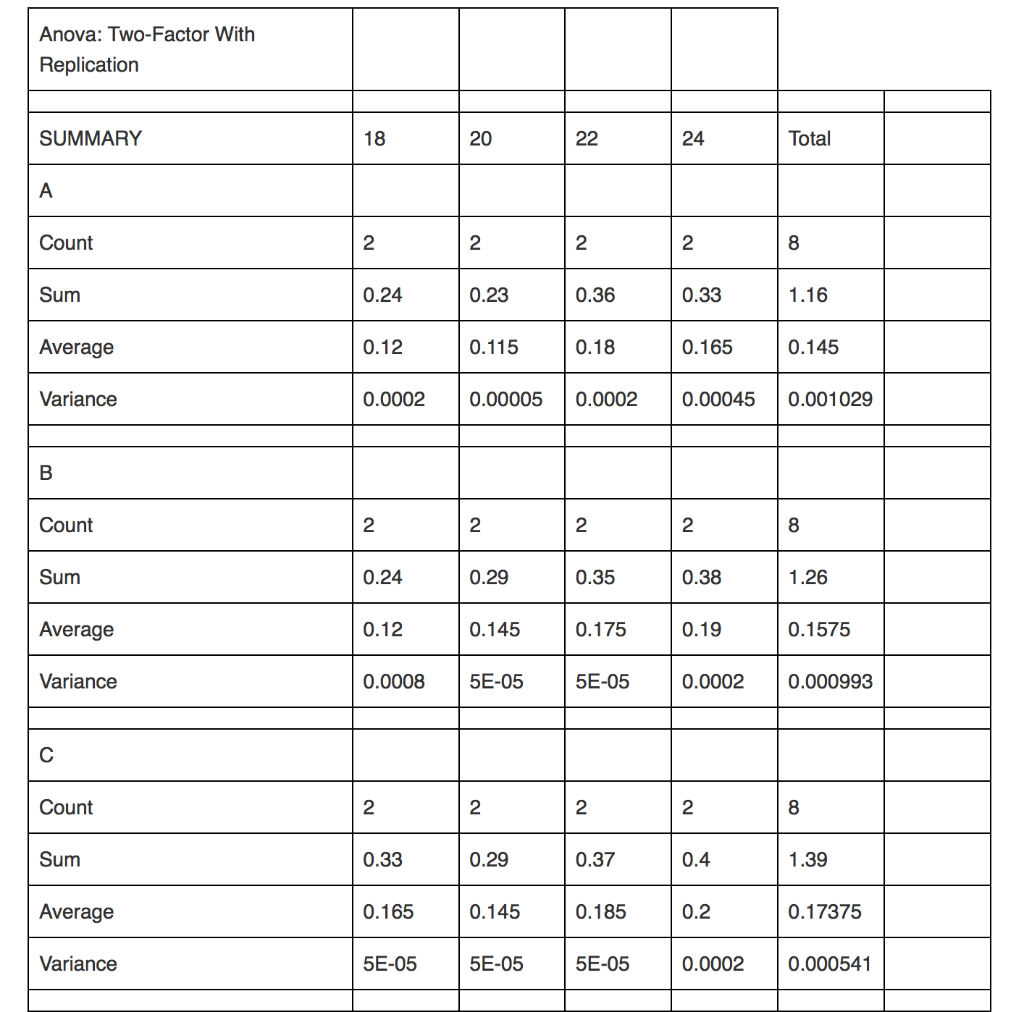
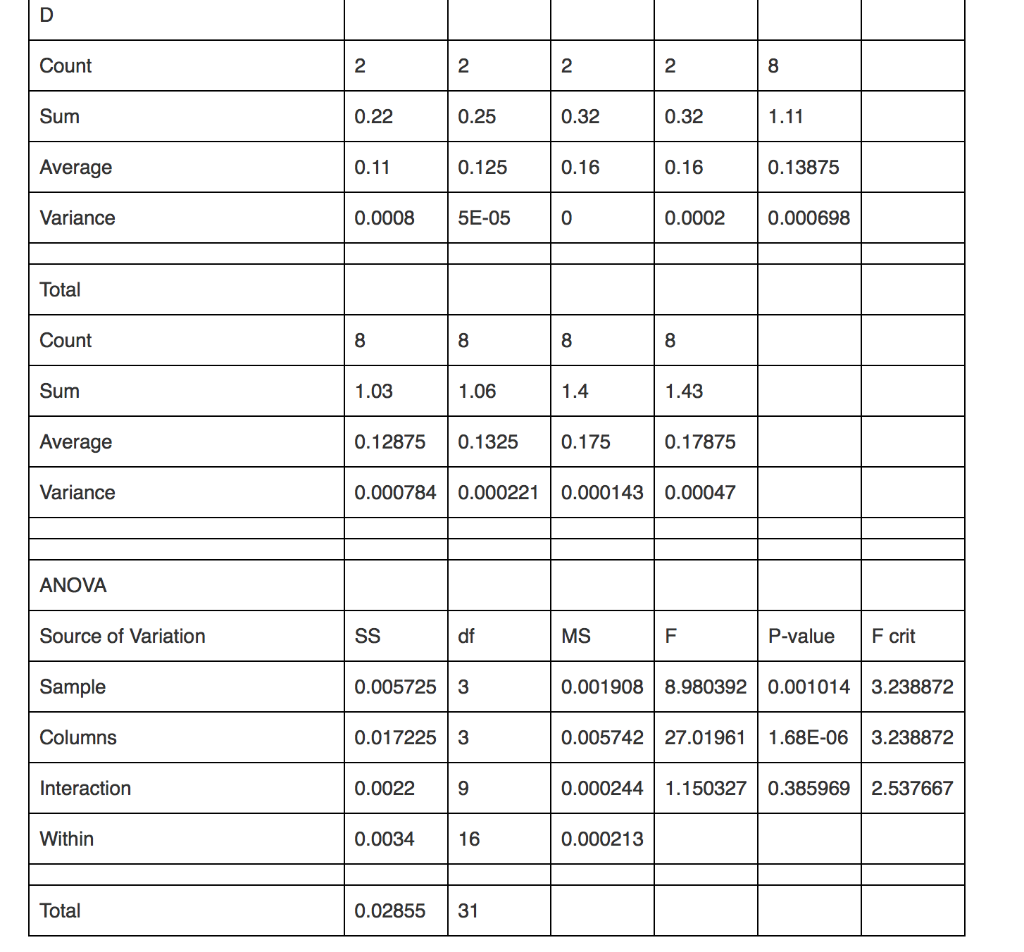
insignificant effect due to interaction at 5% level of significance. Since p-values for both factors are less than 0.05 so the levels of both factors are not all equally effective. Since there is no significant interaction effect and this is also observed from the graph of Part (a), then we test effects of two factors seperately. From ANOVA table we see that p-value corresponding "Cycle Time" is 1.68x10⁻⁶ (
one paragraph, a recommended alternative or course of action that can be taken based on the analysis of the above data.
Anova: Two-Factor With Replication SUMMARY 18 20 22 24 Total A Count 2 2 2 2 8 Sum 0.24 0.23 0.36 0.33 1.16 Average 0.12 0.115 0.18 0.165 0.145 Variance 0.0002 0.00005 0.0002 0.00045 0.001029 B Count 2 2 2 2 8 Sum 0.24 0.29 0.35 0.38 1.26 Average 0.12 0.145 0.175 0.19 0.1575 Variance 0.0008 5E-05 5E-05 0.0002 0.000993 Count 2 2 2 2 8 Sum 0.33 0.29 0.37 0.4 1.39 Average 0.165 0.145 0.185 0.2 0.17375 Variance 5E-05 5E-05 5E-05 0.0002 0.000541 D Count 2 2 2 2 8 Sum 0.22 0.25 0.32 0.32 1.11 Average 0.11 0.125 0.16 0.16 0.13875 Variance 0.0008 5E-05 0 0.0002 0.000698 Total Count 8 8 8 8 Sum 1.03 1.06 1.4 1.43 Average 0.12875 0.1325 0.175 0.17875 Variance 0.000784 0.000221 0.000143 0.00047 ANOVA Source of Variation SS df MS F P-value F crit Sample 0.0057253 0.001908 8.980392 0.001014 3.238872 Columns 0.0172253 0.005742 27.01961 1.68E-06 3.238872 Interaction 0.0022 9 0.000244 1.150327 0.385969 2.537667 Within 0.0034 16 0.000213 Total 0.02855 31 Anova: Two-Factor With Replication SUMMARY 18 20 22 24 Total A Count 2 2 2 2 8 Sum 0.24 0.23 0.36 0.33 1.16 Average 0.12 0.115 0.18 0.165 0.145 Variance 0.0002 0.00005 0.0002 0.00045 0.001029 B Count 2 2 2 2 8 Sum 0.24 0.29 0.35 0.38 1.26 Average 0.12 0.145 0.175 0.19 0.1575 Variance 0.0008 5E-05 5E-05 0.0002 0.000993 Count 2 2 2 2 8 Sum 0.33 0.29 0.37 0.4 1.39 Average 0.165 0.145 0.185 0.2 0.17375 Variance 5E-05 5E-05 5E-05 0.0002 0.000541 D Count 2 2 2 2 8 Sum 0.22 0.25 0.32 0.32 1.11 Average 0.11 0.125 0.16 0.16 0.13875 Variance 0.0008 5E-05 0 0.0002 0.000698 Total Count 8 8 8 8 Sum 1.03 1.06 1.4 1.43 Average 0.12875 0.1325 0.175 0.17875 Variance 0.000784 0.000221 0.000143 0.00047 ANOVA Source of Variation SS df MS F P-value F crit Sample 0.0057253 0.001908 8.980392 0.001014 3.238872 Columns 0.0172253 0.005742 27.01961 1.68E-06 3.238872 Interaction 0.0022 9 0.000244 1.150327 0.385969 2.537667 Within 0.0034 16 0.000213 Total 0.02855 31Step by Step Solution
There are 3 Steps involved in it
Step: 1

Get Instant Access to Expert-Tailored Solutions
See step-by-step solutions with expert insights and AI powered tools for academic success
Step: 2

Step: 3
Ace Your Homework with AI
Get the answers you need in no time with our AI-driven, step-by-step assistance
Get Started
Management Reporting Und Behavioral Accounting Verhaltenswirkungen Des Berichtswesens Im Unternehmen
Authors: Andreas Taschner
2nd., 2nd. Auflage Aufl. 2019 Edition
3658234911, 978-3658234911