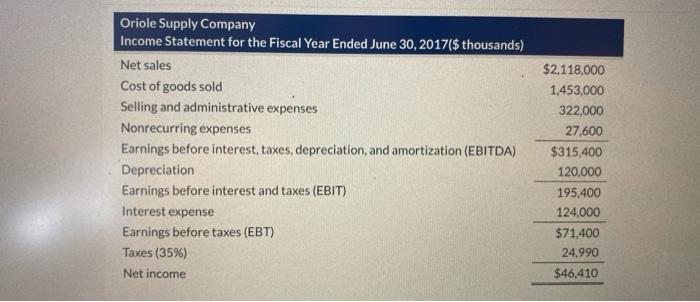
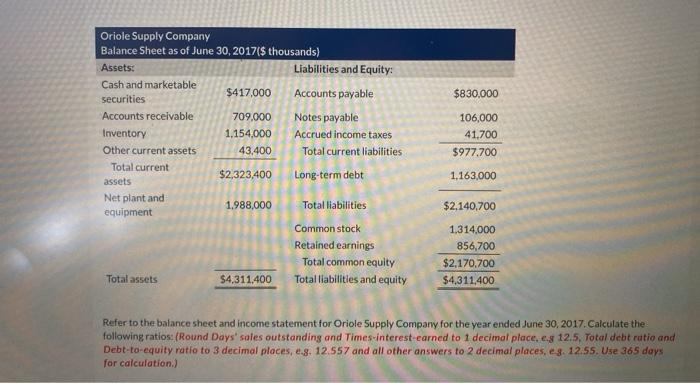
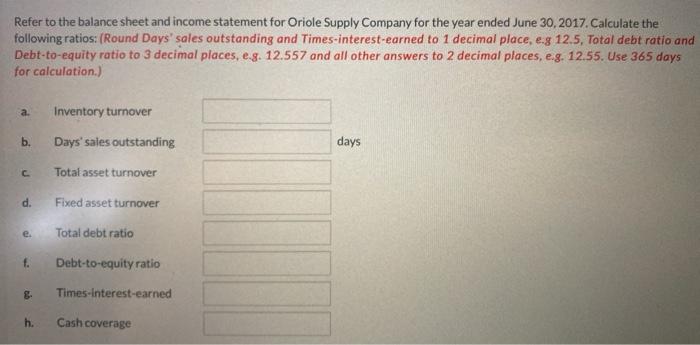
Oriole Supply Company Income Statement for the Fiscal Year Ended June 30, 2017($ thousands) Net sales Cost of goods sold Selling and administrative expenses Nonrecurring expenses Earnings before interest, taxes, depreciation, and amortization (EBITDA) Depreciation Earnings before interest and taxes (EBIT) Interest expense Earnings before taxes (EBT) Taxes (35%) Net income $2,118,000 1,453,000 322,000 27,600 $315,400 120,000 195.400 124,000 $71,400 24,990 $46,410 $830,000 Oriole Supply Company Balance Sheet as of June 30, 2017($ thousands) Assets: Liabilities and Equity: Cash and marketable $417,000 securities Accounts payable Accounts receivable 709,000 Notes payable Inventory 1.154,000 Accrued income taxes Other current assets 43.400 Total current liabilities Total current $2,323,400 Long-term debt assets Net plant and 1.988,000 Total liabilities equipment Common stock Retained earnings Total common equity Total assets $4.311.400 Total liabilities and equity 106,000 41.700 $977.700 1.163,000 $2.140,700 1,314,000 856,700 $2,170.700 $4,311,400 Refer to the balance sheet and income statement for Oriole Supply Company for the year ended June 30, 2017. Calculate the following ratios: (Round Days' sales outstanding and Times-interest-earned to 1 decimal place, eg 12.5, Total debt ratio and Debt-to-equity ratio to 3 decimal places, e.8. 12.557 and all other answers to 2 decimal places, eg. 12.55. Use 365 days for calculation.) Refer to the balance sheet and income statement for Oriole Supply Company for the year ended June 30, 2017. Calculate the following ratios: (Round Days' sales outstanding and Times-interest-earned to 1 decimal place, eg 12.5, Total debt ratio and Debt-to-equity ratio to 3 decimal places, e.g. 12.557 and all other answers to 2 decimal places, e.g. 12.55. Use 365 days for calculation) a. Inventory turnover b. Days' sales outstanding days . Total asset turnover d. Fixed asset turnover e. Total debt ratio f. Debt-to-equity ratio Times-interest-earned h. Cash coverage