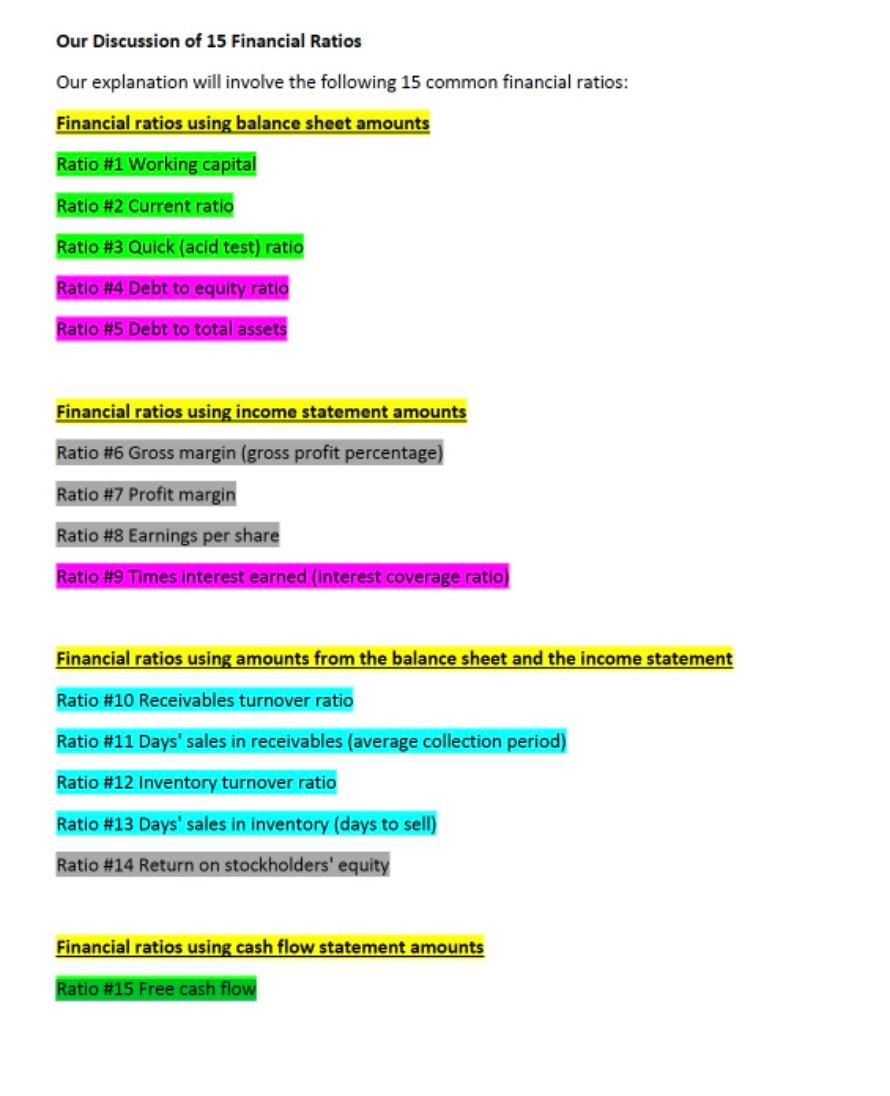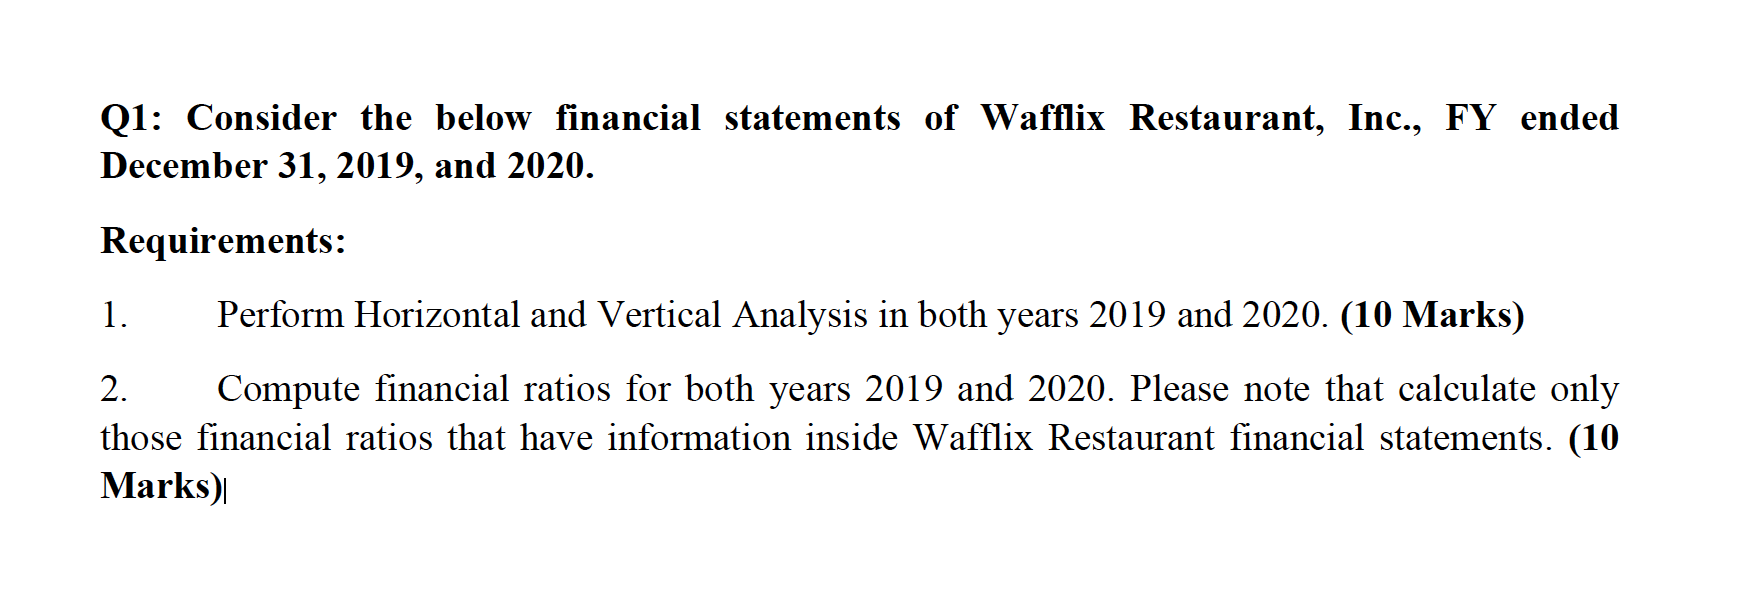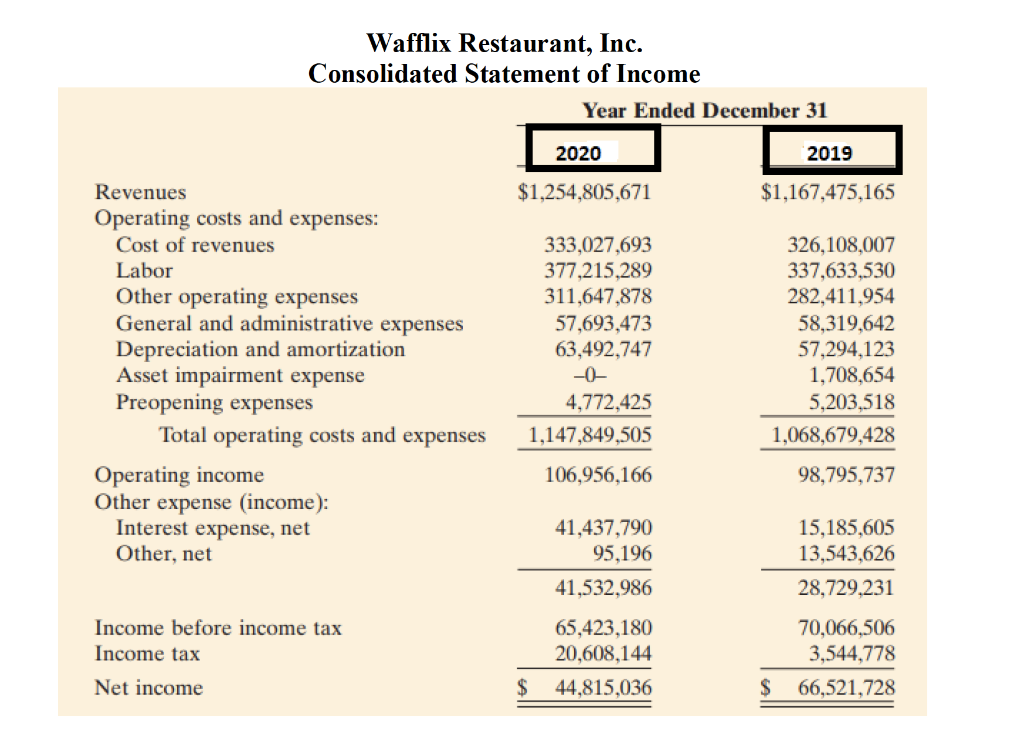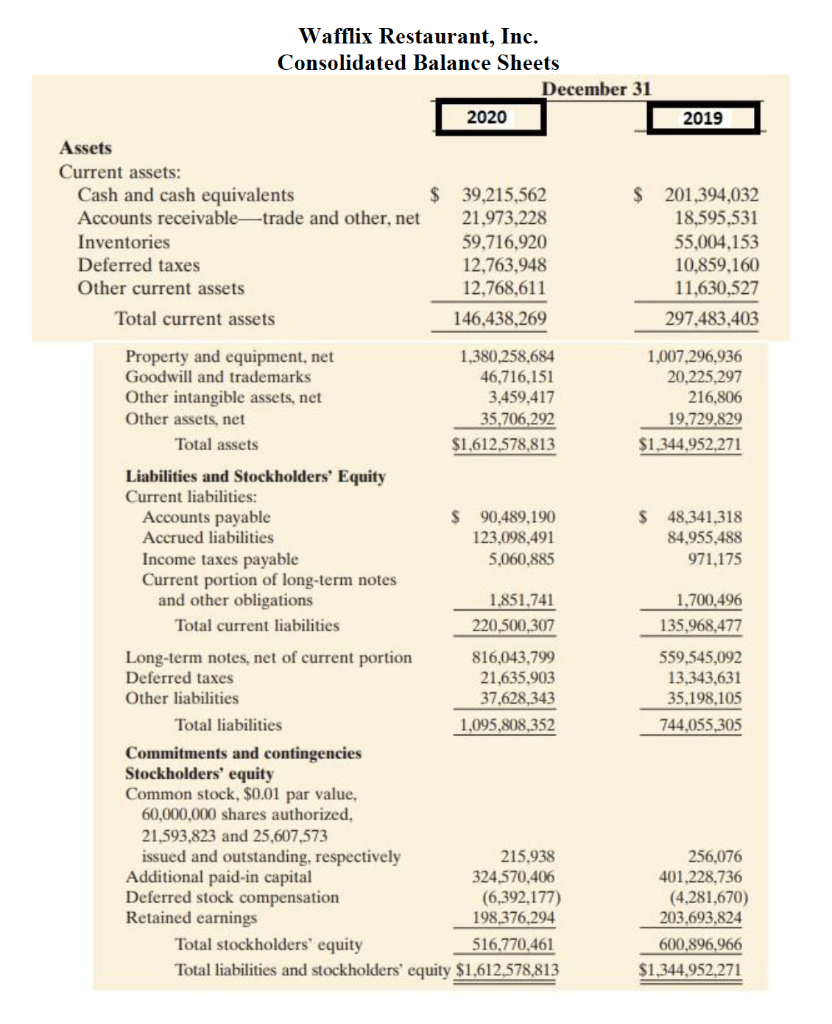


Our Discussion of 15 Financial Ratios Our explanation will involve the following 15 common financial ratios: Financial ratios using balance sheet amounts Ratio #1 Working capital Ratio #2 Current ratio Ratio #3 Quick (acid test) ratio Ratio #4 Debt to equity ratio Ratio #5 Debt to total assets Financial ratios using income statement amounts Ratio #6 Gross margin (gross profit percentage) Ratio #7 Profit margin Ratio #8 Earnings per share Ratio #9 Times interest earned (interest coverage ratio) Financial ratios using amounts from the balance sheet and the income statement Ratio #10 Receivables turnover ratio Ratio #11 Days' sales in receivables (average collection period) Ratio #12 Inventory turnover ratio Ratio #13 Days' sales in inventory (days to sell) Ratio #14 Return on stockholders' equity Financial ratios using cash flow statement amounts Ratio #15 Free cash flow calculatethese 15ratio Q1: Consider the below financial statements of Wafflix Restaurant, Inc., FY ended December 31, 2019, and 2020. Requirements: 1. Perform Horizontal and Vertical Analysis in both years 2019 and 2020. (10 Marks) 2. Compute financial ratios for both years 2019 and 2020. Please note that calculate only those financial ratios that have information inside Wafflix Restaurant financial statements. (10 Marks) Wafflix Restaurant, Inc. Consolidated Statement of Income Year Ended December 31 2020 2019 $1,254,805,671 $1,167,475,165 Revenues Operating costs and expenses: Cost of revenues Labor Other operating expenses General and administrative expenses Depreciation and amortization Asset impairment expense Preopening expenses Total operating costs and expenses Operating income Other expense (income): Interest expense, net Other, net 333,027,693 377,215,289 311,647,878 57,693,473 63,492,747 -0- 4,772,425 1,147,849,505 326,108,007 337,633,530 282,411,954 58,319,642 57,294,123 1,708,654 5,203,518 1,068,679,428 106,956,166 98,795,737 41,437,790 95,196 15,185,605 13,543,626 28,729,231 Income before income tax Income tax Net income 41,532,986 65,423,180 20,608,144 44,815,036 70,066,506 3,544,778 66,521,728 $ $ Wafflix Restaurant, Inc. Consolidated Balance Sheets December 31 2020 2019 Assets Current assets: Cash and cash equivalents Accounts receivable-trade and other, net Inventories Deferred taxes Other current assets Total current assets $ 39,215,562 21,973,228 59,716,920 12,763,948 12,768,611 146,438,269 $ 201,394,032 18,595,531 55,004,153 10,859,160 11,630,527 297,483,403 1,007,296,936 20,225,297 216,806 19.729,829 $1,344,952,271 $ 48,341,318 84,955,488 971,175 1.700,496 135,968,477 Property and equipment, net 1,380,258,684 Goodwill and trademarks 46,716,151 Other intangible assets, net 3,459,417 Other assets, net 35,706,292 Total assets $1,612,578,813 Liabilities and Stockholders' Equity Current liabilities: Accounts payable $ 90,489,190 Accrued liabilities 123,098,491 Income taxes payable 5,060,885 Current portion of long-term notes and other obligations 1,851.741 Total current liabilities 220,500,307 Long-term notes, net of current portion 816,043.799 Deferred taxes 21.635,903 Other liabilities 37.628,343 Total liabilities 1,095,808,352 Commitments and contingencies Stockholders' equity Common stock. $0.01 par value, 60,000,000 shares authorized, 21,593,823 and 25,607,573 issued and outstanding, respectively 215,938 Additional paid-in capital 324,570,406 Deferred stock compensation (6,392.177) Retained earnings 198,376,294 Total stockholders' equity 516,770,461 Total liabilities and stockholders' equity $1,612,578,813 559,545,092 13,343,631 35,198,105 744,055,305 256,076 401,228,736 (4,281,670) 203.693,824 600,896,966 $1,344,952,271 Our Discussion of 15 Financial Ratios Our explanation will involve the following 15 common financial ratios: Financial ratios using balance sheet amounts Ratio #1 Working capital Ratio #2 Current ratio Ratio #3 Quick (acid test) ratio Ratio #4 Debt to equity ratio Ratio #5 Debt to total assets Financial ratios using income statement amounts Ratio #6 Gross margin (gross profit percentage) Ratio #7 Profit margin Ratio #8 Earnings per share Ratio #9 Times interest earned (interest coverage ratio) Financial ratios using amounts from the balance sheet and the income statement Ratio #10 Receivables turnover ratio Ratio #11 Days' sales in receivables (average collection period) Ratio #12 Inventory turnover ratio Ratio #13 Days' sales in inventory (days to sell) Ratio #14 Return on stockholders' equity Financial ratios using cash flow statement amounts Ratio #15 Free cash flow calculatethese 15ratio Q1: Consider the below financial statements of Wafflix Restaurant, Inc., FY ended December 31, 2019, and 2020. Requirements: 1. Perform Horizontal and Vertical Analysis in both years 2019 and 2020. (10 Marks) 2. Compute financial ratios for both years 2019 and 2020. Please note that calculate only those financial ratios that have information inside Wafflix Restaurant financial statements. (10 Marks) Wafflix Restaurant, Inc. Consolidated Statement of Income Year Ended December 31 2020 2019 $1,254,805,671 $1,167,475,165 Revenues Operating costs and expenses: Cost of revenues Labor Other operating expenses General and administrative expenses Depreciation and amortization Asset impairment expense Preopening expenses Total operating costs and expenses Operating income Other expense (income): Interest expense, net Other, net 333,027,693 377,215,289 311,647,878 57,693,473 63,492,747 -0- 4,772,425 1,147,849,505 326,108,007 337,633,530 282,411,954 58,319,642 57,294,123 1,708,654 5,203,518 1,068,679,428 106,956,166 98,795,737 41,437,790 95,196 15,185,605 13,543,626 28,729,231 Income before income tax Income tax Net income 41,532,986 65,423,180 20,608,144 44,815,036 70,066,506 3,544,778 66,521,728 $ $ Wafflix Restaurant, Inc. Consolidated Balance Sheets December 31 2020 2019 Assets Current assets: Cash and cash equivalents Accounts receivable-trade and other, net Inventories Deferred taxes Other current assets Total current assets $ 39,215,562 21,973,228 59,716,920 12,763,948 12,768,611 146,438,269 $ 201,394,032 18,595,531 55,004,153 10,859,160 11,630,527 297,483,403 1,007,296,936 20,225,297 216,806 19.729,829 $1,344,952,271 $ 48,341,318 84,955,488 971,175 1.700,496 135,968,477 Property and equipment, net 1,380,258,684 Goodwill and trademarks 46,716,151 Other intangible assets, net 3,459,417 Other assets, net 35,706,292 Total assets $1,612,578,813 Liabilities and Stockholders' Equity Current liabilities: Accounts payable $ 90,489,190 Accrued liabilities 123,098,491 Income taxes payable 5,060,885 Current portion of long-term notes and other obligations 1,851.741 Total current liabilities 220,500,307 Long-term notes, net of current portion 816,043.799 Deferred taxes 21.635,903 Other liabilities 37.628,343 Total liabilities 1,095,808,352 Commitments and contingencies Stockholders' equity Common stock. $0.01 par value, 60,000,000 shares authorized, 21,593,823 and 25,607,573 issued and outstanding, respectively 215,938 Additional paid-in capital 324,570,406 Deferred stock compensation (6,392.177) Retained earnings 198,376,294 Total stockholders' equity 516,770,461 Total liabilities and stockholders' equity $1,612,578,813 559,545,092 13,343,631 35,198,105 744,055,305 256,076 401,228,736 (4,281,670) 203.693,824 600,896,966 $1,344,952,271


