Answered step by step
Verified Expert Solution
Question
1 Approved Answer
Our firm - Coffee Services Company - makes and delivers coffee kits used in high-throughput coffee machines used by restaurants and large offices. The

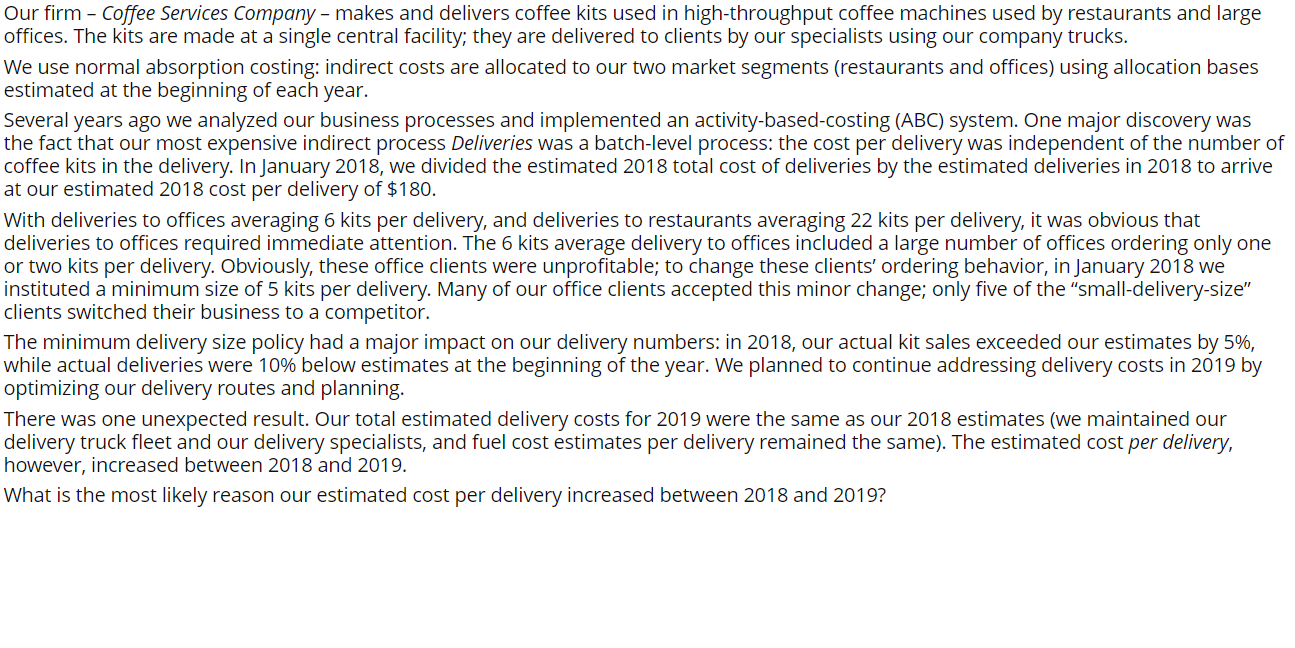
Our firm - Coffee Services Company - makes and delivers coffee kits used in high-throughput coffee machines used by restaurants and large offices. The kits are made at a single central facility; they are delivered to clients by our specialists using our company trucks. We use normal absorption costing: indirect costs are allocated to our two market segments (restaurants and offices) using allocation bases estimated at the beginning of each year. Several years ago we analyzed our business processes and implemented an activity-based-costing (ABC) system. One major discovery was the fact that our most expensive indirect process Deliveries was a batch-level process: the cost per delivery was independent of the number of coffee kits in the delivery. In January 2018, we divided the estimated 2018 total cost of deliveries by the estimated deliveries in 2018 to arrive at our estimated 2018 cost per delivery of $180. With deliveries to offices averaging 6 kits per delivery, and deliveries to restaurants averaging 22 kits per delivery, it was obvious that deliveries to offices required immediate attention. The 6 kits average delivery to offices included a large number of offices ordering only one or two kits per delivery. Obviously, these office clients were unprofitable; to change these clients' ordering behavior, in January 2018 we instituted a minimum size of 5 kits per delivery. Many of our office clients accepted this minor change; only five of the "small-delivery-size" clients switched their business to a competitor. The minimum delivery size policy had a major impact on our delivery numbers: in 2018, our actual kit sales exceeded our estimates by 5%, while actual deliveries were 10% below estimates at the beginning of the year. We planned to continue addressing delivery costs in 2019 by optimizing our delivery routes and planning. There was one unexpected result. Our total estimated delivery costs for 2019 were the same as our 2018 estimates (we maintained our delivery truck fleet and our delivery specialists, and fuel cost estimates per delivery remained the same). The estimated cost per delivery, however, increased between 2018 and 2019. What is the most likely reason our estimated cost per delivery increased between 2018 and 2019?
Step by Step Solution
There are 3 Steps involved in it
Step: 1
The most likely reason for the increase in the estimated cost per delivery between 2018 and 2019 des...
Get Instant Access to Expert-Tailored Solutions
See step-by-step solutions with expert insights and AI powered tools for academic success
Step: 2

Step: 3

Ace Your Homework with AI
Get the answers you need in no time with our AI-driven, step-by-step assistance
Get Started


