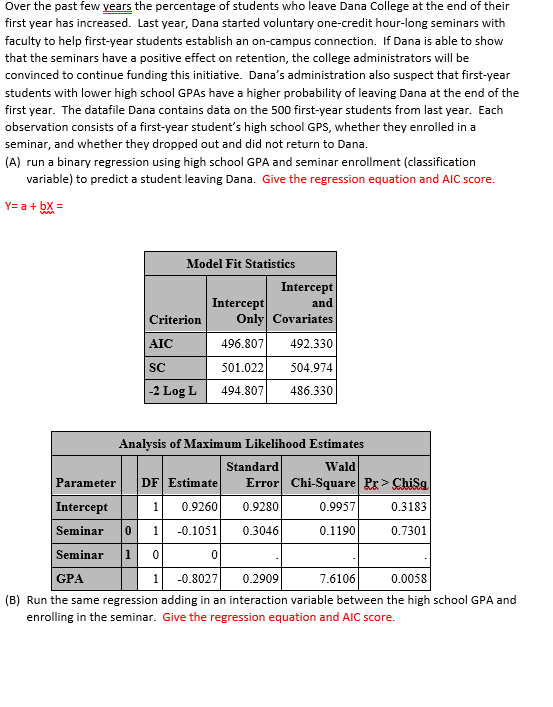
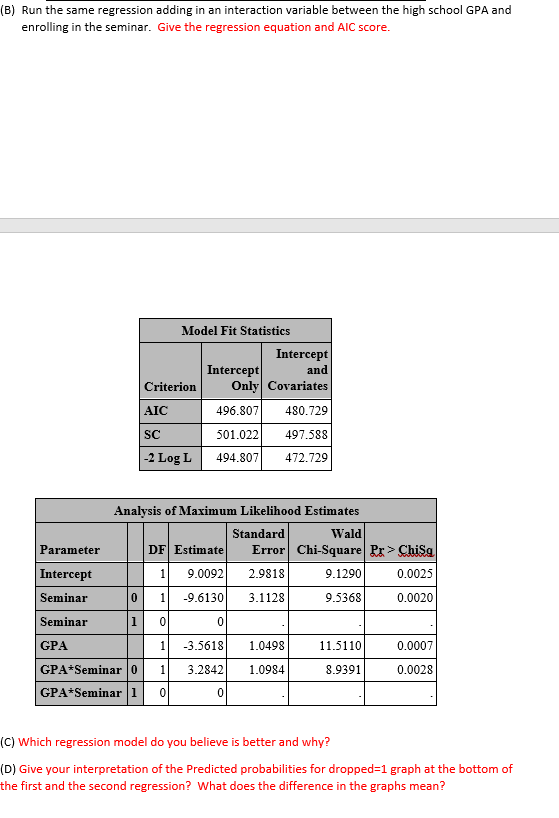
Over the past few years the percentage of students who leave Dana College at the end of their first year has increased. Last year, Dana started voluntary one-credit hour-long seminars with faculty to help first-year students establish an on-campus connection. If Dana is able to show that the seminars have a positive effect on retention, the college administrators will be convinced to continue funding this initiative. Dana's administration also suspect that first-year students with lower high school GPAs have a higher probability of leaving Dana at the end of the first year. The datafile Dana contains data on the 500 first-year students from last year. Each observation consists of a first-year student's high school GPS, whether they enrolled in a seminar, and whether they dropped out and did not return to Dana. (A) run a binary regression using high school GPA and seminar enrollment (classification variable) to predict a student leaving Dana. Give the regression equation and AIC score. Y= a + bX = Model Fit Statistics Intercept Intercept and Criterion Only Covariates AIC 496.807 492.330 SC 501.02 504.974 -2 Log L 494.807 486.330 Analysis of Maximum Likelihood Estimates Standard Wald Parameter DF Estimate Error Chi-Square Pr > ChiSq Intercept 0.9260 0.9280 0.9957 0.3183 Seminar -0.1051 0.3046 0.1190 0.7301 Seminar GPA -0.8027 0.2909 7.6106 0.0058 (B) Run the same regression adding in an interaction variable between the high school GPA and enrolling in the seminar. Give the regression equation and AIC score.[B1 Run the same regression adding in an interaction variable between the high school GPA and enrolling in the seminar. Give the regression equation and AIC score. 496.80? 501.022 491583 432.129 11.5110 3.2842. 1.0934- 3.9391 0.0023 [C] Which regression model do you believe is better and why? ID} Give your interpretation ofle Predicted probabilities tor dropped=1 graph at the bottom of the rst and the second regrsion? What does the difference in the graphs mean