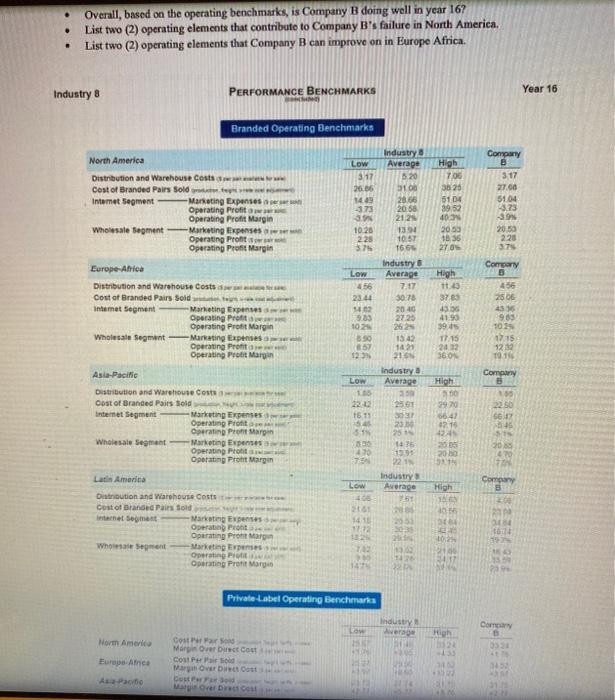
. . Overall, based on the operating benchmarks, is Company B doing well in year 16? List two (2) operating elements that contribute to Company B's failure in North America. List two (2) operating elements that Company B can improve on in Europe Africa. . Industry 8 PERFORMANCE BENCHMARKS Year 16 Branded Operating Benchmarks High To North America Distribution and Warehouse Costa Cost of Branded Pairs Sold Internet segment -Marketing Expenses Operating Profit Operating Profit Margin Wholesale segment Marketing Expenses Operating Profit Operating Profit Margin Low 317 26.06 149 -373 -35 10.28 225 $ Industry Average 520 3100 28.64 20 58 21.25 1394 3828 51 04 39 52 40 2050 t. 36 270 Company B 317 27.00 5104 -3.73 -3.99 2050 220 37 10.57 1665 Company Europe Africa Distribution and Warehouse Costs Cost of Branded Pairs Sold Intemet segment Marketing Expenses Operating Profit Operating Profit Margin Wholesale segment Marketing Expenses Operating pronta Operating profit Margo Low 456 23:44 43 9.83 102 Industry Average 7.17 30.78 2040 2725 2624 1342 1421 215 Industry Average High 11.3 3783 4336 41.90 395 17:15 2012 SON 456 2506 4515 985 TON 0715 122 12.11 857 12 Asia-Pacific Low 105 250 15.11 Distribution and Warehouse Costa Cost of Branded Pairs Sold internet Segment Marketing Expenses Operating profit Operatin Pront Marin Wholesale segment Marketing Expenses Operating Pro Operating Pront Margin High 500 2920 56.41 12.10 424 28 2000 2561 303 23 251 1415 51325+ 22 1 Industry Average 751 Company B 150 22.50 66.17 35 51 2059 070 TE 5.15 396 14 75 Company B Low 400 High 100 1050 Latin America Distribution and Warehouse Costs Cost of Branded Pairs old Marketing Expenses Operatin Pont Operating Pront Margon Who Set Marketing Expenses Operating Operating Pront Mary 2 152 71 2012 21 1:32 13 3210 17 14 23 Private Label Operating Benchmarka Industry Average Comory LOW High 32 North America 253 Eure Africa Costuar Mary Over Duct Cou Cost Perod Mar Oost Duster 25 . . Overall, based on the operating benchmarks, is Company B doing well in year 16? List two (2) operating elements that contribute to Company B's failure in North America. List two (2) operating elements that Company B can improve on in Europe Africa. . Industry 8 PERFORMANCE BENCHMARKS Year 16 Branded Operating Benchmarks High To North America Distribution and Warehouse Costa Cost of Branded Pairs Sold Internet segment -Marketing Expenses Operating Profit Operating Profit Margin Wholesale segment Marketing Expenses Operating Profit Operating Profit Margin Low 317 26.06 149 -373 -35 10.28 225 $ Industry Average 520 3100 28.64 20 58 21.25 1394 3828 51 04 39 52 40 2050 t. 36 270 Company B 317 27.00 5104 -3.73 -3.99 2050 220 37 10.57 1665 Company Europe Africa Distribution and Warehouse Costs Cost of Branded Pairs Sold Intemet segment Marketing Expenses Operating Profit Operating Profit Margin Wholesale segment Marketing Expenses Operating pronta Operating profit Margo Low 456 23:44 43 9.83 102 Industry Average 7.17 30.78 2040 2725 2624 1342 1421 215 Industry Average High 11.3 3783 4336 41.90 395 17:15 2012 SON 456 2506 4515 985 TON 0715 122 12.11 857 12 Asia-Pacific Low 105 250 15.11 Distribution and Warehouse Costa Cost of Branded Pairs Sold internet Segment Marketing Expenses Operating profit Operatin Pront Marin Wholesale segment Marketing Expenses Operating Pro Operating Pront Margin High 500 2920 56.41 12.10 424 28 2000 2561 303 23 251 1415 51325+ 22 1 Industry Average 751 Company B 150 22.50 66.17 35 51 2059 070 TE 5.15 396 14 75 Company B Low 400 High 100 1050 Latin America Distribution and Warehouse Costs Cost of Branded Pairs old Marketing Expenses Operatin Pont Operating Pront Margon Who Set Marketing Expenses Operating Operating Pront Mary 2 152 71 2012 21 1:32 13 3210 17 14 23 Private Label Operating Benchmarka Industry Average Comory LOW High 32 North America 253 Eure Africa Costuar Mary Over Duct Cou Cost Perod Mar Oost Duster 25


