

Answered step by step
Verified Expert Solution
Question
1 Approved Answer
Overview: For this assignment, you will apply your knowledge of experimental research to determine if there is a statistically significant difference between mean (average)
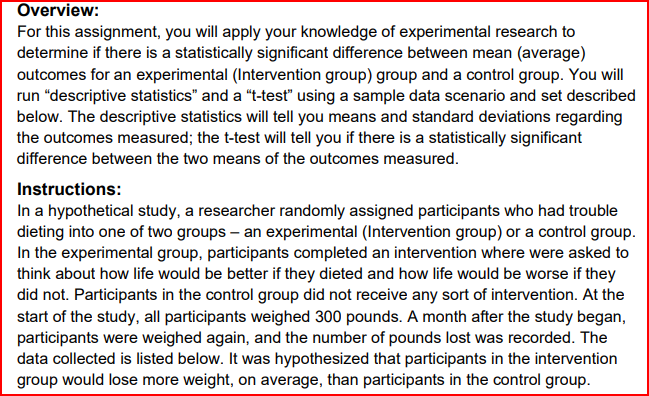
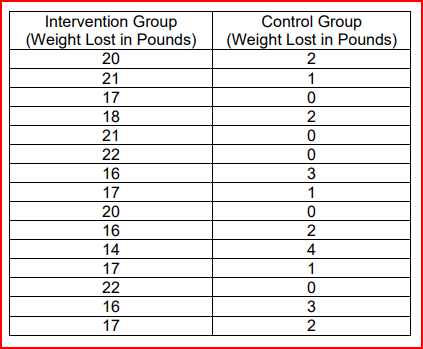
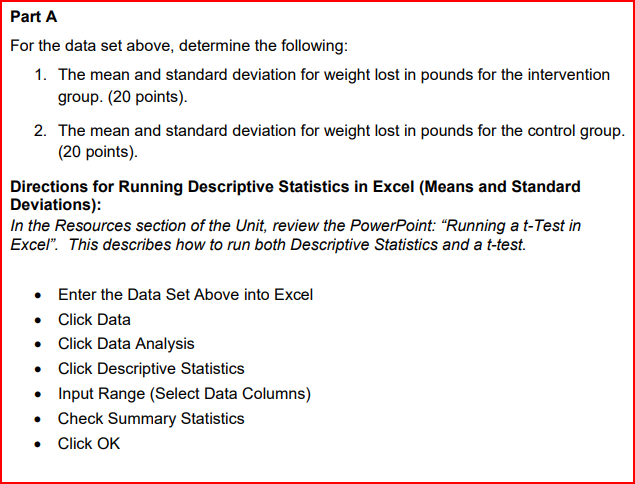
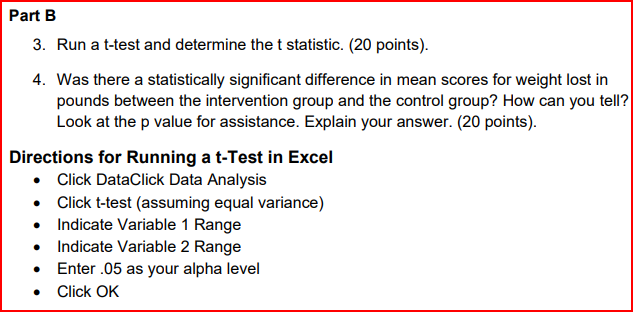
Overview: For this assignment, you will apply your knowledge of experimental research to determine if there is a statistically significant difference between mean (average) outcomes for an experimental (Intervention group) group and a control group. You will run "descriptive statistics" and a "t-test" using a sample data scenario and set described below. The descriptive statistics will tell you means and standard deviations regarding the outcomes measured; the t-test will tell you if there is a statistically significant difference between the two means of the outcomes measured. Instructions: In a hypothetical study, a researcher randomly assigned participants who had trouble dieting into one of two groups - an experimental (Intervention group) or a control group. In the experimental group, participants completed an intervention where were asked to think about how life would be better if they dieted and how life would be worse if they did not. Participants in the control group did not receive any sort of intervention. At the start of the study, all participants weighed 300 pounds. A month after the study began, participants were weighed again, and the number of pounds lost was recorded. The data collected is listed below. It was hypothesized that participants in the intervention group would lose more weight, on average, than participants in the control group. Intervention Group (Weight Lost in Pounds) Control Group (Weight Lost in Pounds) 2 1 20 21 17 18 21 22 0200 16 3 17 1 20 0 16 2 14 4 17 1 22 0 16 3 17 2 Part A For the data set above, determine the following: 1. The mean and standard deviation for weight lost in pounds for the intervention group. (20 points). 2. The mean and standard deviation for weight lost in pounds for the control group. (20 points). Directions for Running Descriptive Statistics in Excel (Means and Standard Deviations): In the Resources section of the Unit, review the PowerPoint: "Running a t-Test in Excel". This describes how to run both Descriptive Statistics and a t-test. Enter the Data Set Above into Excel Click Data Click Data Analysis Click Descriptive Statistics Input Range (Select Data Columns) Check Summary Statistics Click OK Part B 3. Run a t-test and determine the t statistic. (20 points). 4. Was there a statistically significant difference in mean scores for weight lost in pounds between the intervention group and the control group? How can you tell? Look at the p value for assistance. Explain your answer. (20 points). Directions for Running a t-Test in Excel Click DataClick Data Analysis Click t-test (assuming equal variance) Indicate Variable 1 Range Indicate Variable 2 Range Enter .05 as your alpha level Click OK Part C 2022 Post University, Waterbury, CT ALL RIGHTS RESERVED 5. Create a bar graph of the means for weight lost in pounds for both the intervention group and the control group. Add a title and label your axes. (20 points). Directions for Creating a Bar Graph in Excel Refer to the video under Readings and Resources in Unit 6, entitled, "Column Graphs and t-test in Excel" for help in creating a bar graph using Excel. You may also refer to the "Creating a Bar Graph in Excel" PowerPoint under the Unit 6 Readings and Resources.
Step by Step Solution
There are 3 Steps involved in it
Step: 1

Get Instant Access to Expert-Tailored Solutions
See step-by-step solutions with expert insights and AI powered tools for academic success
Step: 2

Step: 3
Ace Your Homework with AI
Get the answers you need in no time with our AI-driven, step-by-step assistance
Get Started
Collecting And Interpreting Qualitative Materials
Authors: Norman K Denzin, Yvonna S Lincoln
4th Edition
148330731X, 9781483307312