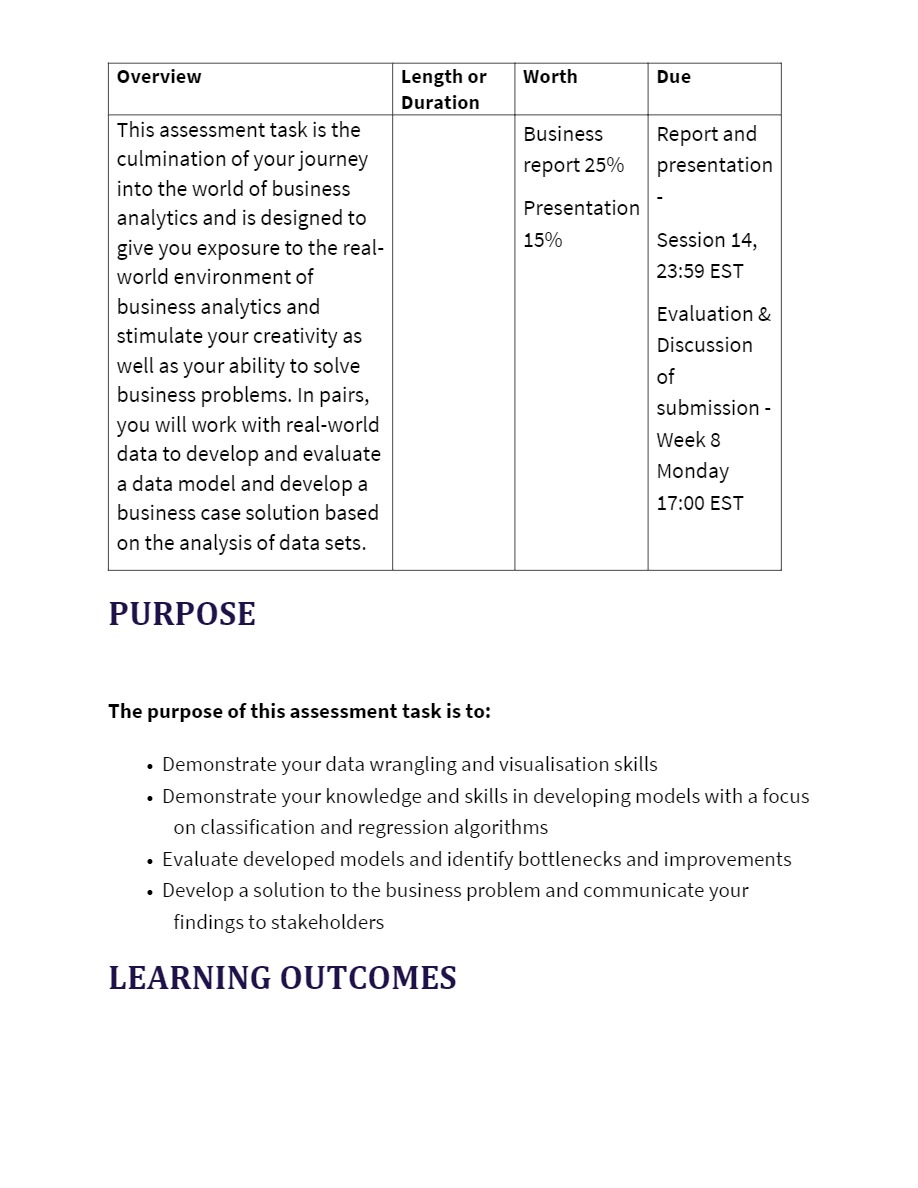
Overview Length or This assessment task is the culmination of yourjourney into the world of business analytics and is designed to give you exposure to
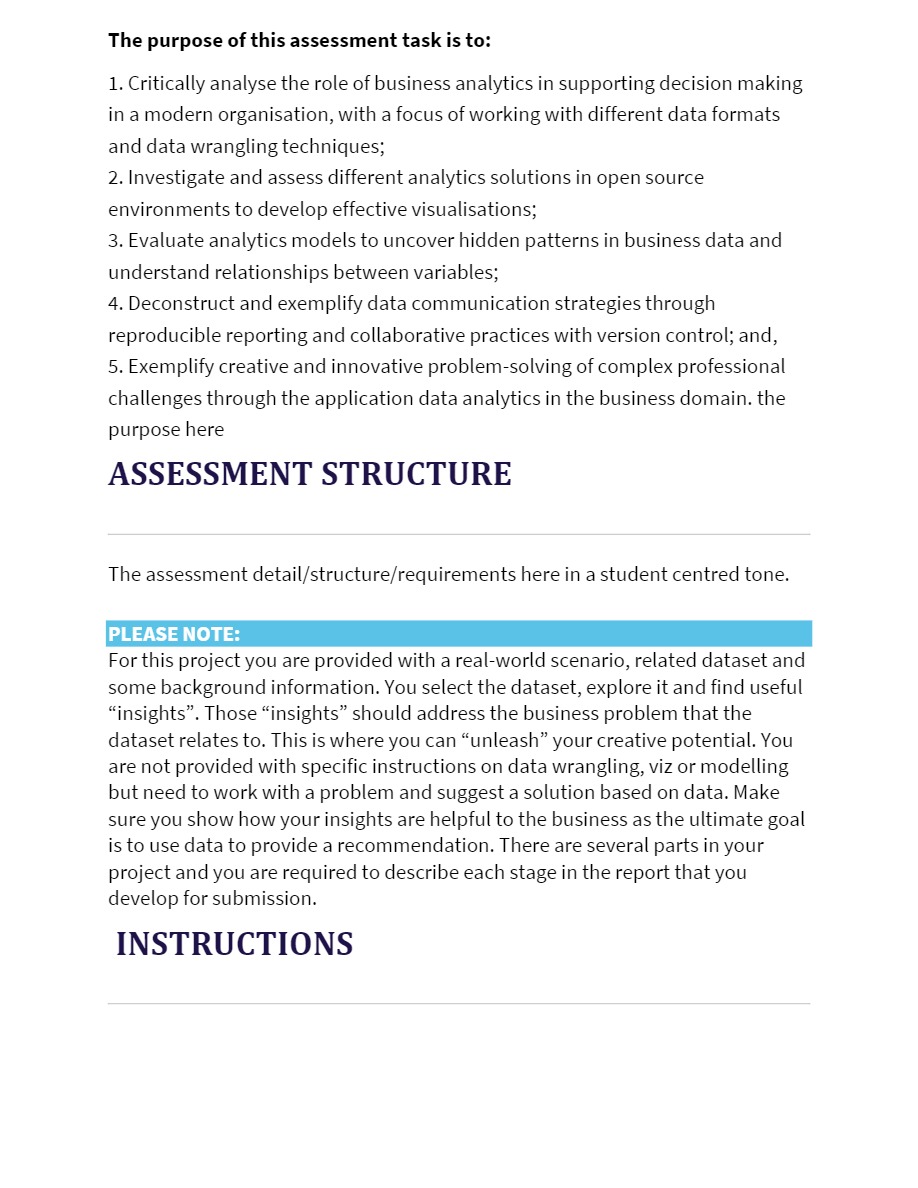
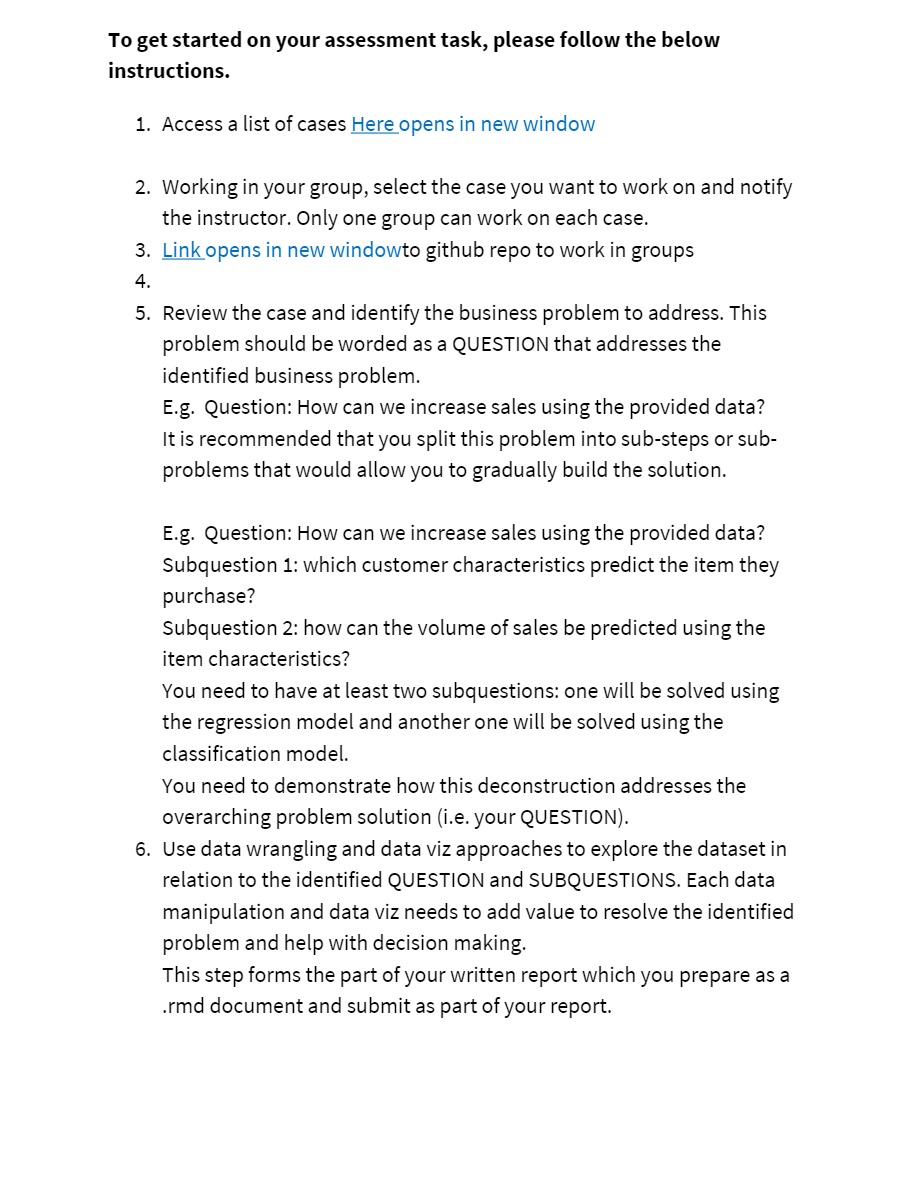
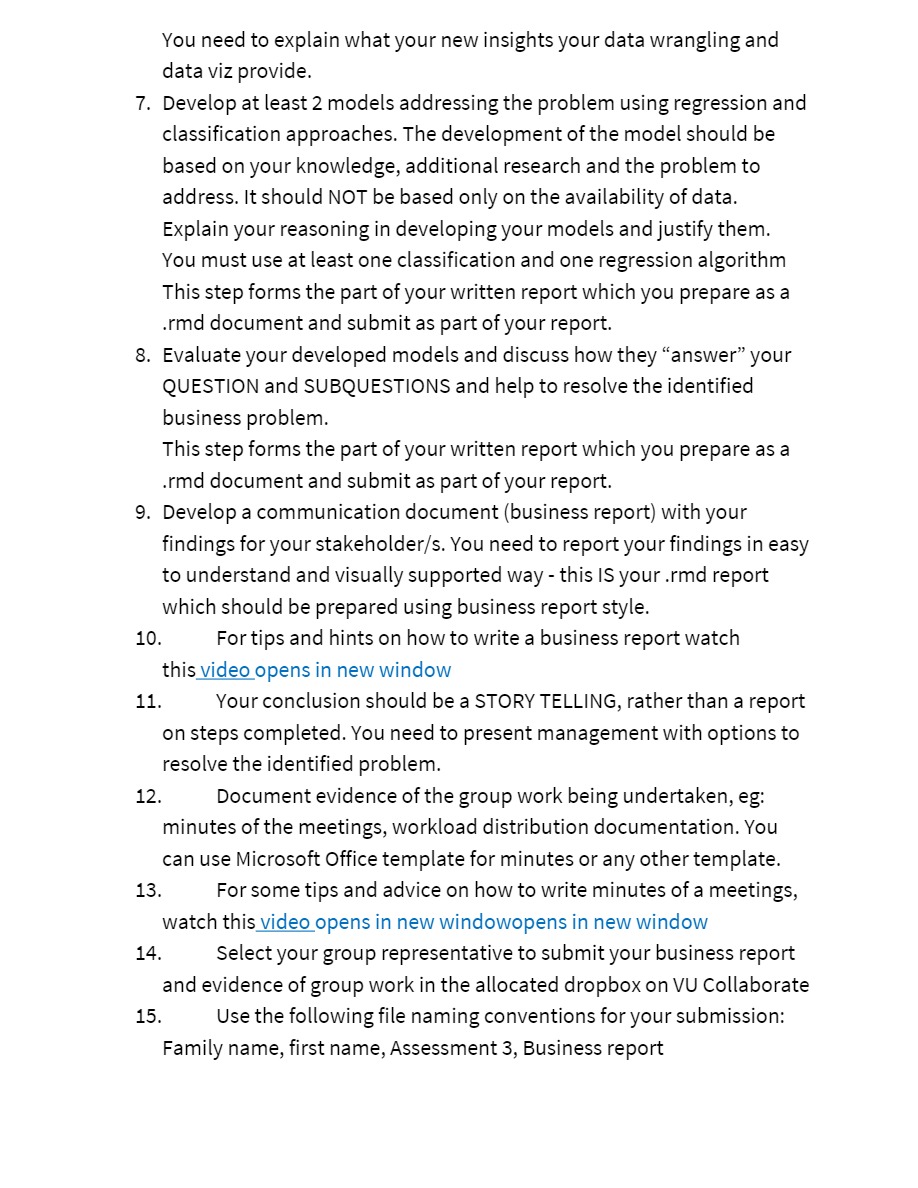
Overview Length or This assessment task is the culmination of yourjourney into the world of business analytics and is designed to give you exposure to the real- world environment of business analytics and stimulate you r creativity as well as your ability to solve business problems. In pairs, you will work with real-world data to develop and evaluate a data model and develop a business case solution based on the analysis of data sets. Duration Bu si ness re port 25% Presentation 15% Report and presentation Session 14, 23:59 EST Evaluation & Discussion of submission - Week 8 Monday 17:00 EST PURPOSE The purpose of this assessment task is to: - Demonstrate your data wrangling and visualisation skills - Demonstrate your knowledge and skills in developing models with a focus on classication and regression algorithms - Evaluate developed models and identify bottlenecks and improvements - Develop a solution to the business problem and communicate your findings to stakeholders LEARNING OUTCOMES The purpose of this assessment task is to: 1. Critically analyse the role of business analytics in supporting decision making in a modern organisation, with a focus of working with different data formats and data wrangling techniques; 2. Investigate and assess different analytics solutions in open source environments to develop effective visualisations; 3. Evaluate analytics models to uncover hidden patterns in business data and understand relationships between variables; 4. Deconstruct and exemplify data communication strategies through reproducible reporting and collaborative practices with version control; and, 5. Exemplify creative and innovative problemsolving of complex professional challenges through the application data analytics in the business domain. the purpose here ASSESSMENT STRUCTURE The assessment detailistructurefrequirements here in a student centred tone. For this project you are provided with a realworld scenario, related dataset and some background information. You select the dataset, explore it and find useful \"insights\". Those \"insights\" should address the business problem that the dataset relates to. This is where you can \"unleash\" your creative potential. You are not provided with specic instructions on data wrangling, viz or modelling but need to work with a problem and suggest a solution based on data. Make sure you show how your insights are helpful to the business as the ultimate goal is to use data to provide a recommendation. There are several parts in your project and you are required to describe each stage in the report that you develop for submission. INSTRUCTIONS To get started on your assessment task, please followr the below instructions. 1. Access a list of cases Here opens in new window 2. Working in your group, select the case you want to work on and notify the instructor. Only one group can work on each case. 3. Link opens in new windowto github repo to work in groups 5. Review the case and identify the business problem to address. This problem should be worded as a QUESTION that addresses the identified business problem. E.g. Question: How can we increase sales using the provided data? It is recommended that you split this problem into su b-steps or sub- problems that would allow you to gradually build the solution. E.g. Question: How can we increase sales using the provided data? Subquestion 1: which customer characteristics predict the item they purchase? Subquestion 2: how can the volume of sales be predicted using the item characteristics? You need to have at least two subquestions: one will be solved using the regression model and another one will be solved using the classification model. You need to demonstrate how this deconstruction addresses the overarching problem solution (i.e. you r QUESTION]. 6. Use data wrangling and data viz approaches to explore the dataset in relation to the identified QUESTION and SUBQUESTIONS. Each data manipulation and data viz needs to add value to resolve the identified problem and help with decision making. This step forms the part of your written report which you prepare as a .rmd document and submit as part of your report. You need to explain what your new insights your data wrangling and data viz provide. 7. Develop at least 2 models addressing the problem using regression and classification approaches. The development of the model should be based on your knowledge, additional research and the problem to address. It should NOT be based only on the availability of data. Explain your reasoning in developing your models and justify them. You must use at least one classification and one regression algorithm This step forms the part of your written report which you prepare as a .rmd document and submit as part of your report. 8. Evaluate your developed models and discuss how they \"answer\" your QUESTION and SU BQUESTIONS and help to resolve the identified business problem. This step forms the part of your written report which you prepare as a .rmd document and submit as part ofyour report. 9. Develop a communication document {business report) with your findings for your stakeholden's. You need to report your findings in easy to understand and visually supported way - this IS your .rmd report which should be prepared using business report style. 10. For tips and hints on how to write a business report watch thisvidiopens in new window 11. Your conclusion should be a STORY TELLING, rather than a report on steps completed. You need to present management with options to resolve the identified problem. 12. Document evidence of the group work being undertaken, eg: minutes of the meetings, workload distribution documentation. You can use Microsoft Office template for minutes or any other template. 13. For some tips and advice on how to write minutes of a meetings, watch thisvidiopens in new windowopens in new window 14. Select your group representative to submit your business report and evidence of group work in the allocated dropbox on VU Collaborate 15. Use the following fiie naming conventions for your submission: Family name, rst name, Assessment 3, Business report Presentation 1. Use PPT or any other suitable software to create slides for your presentation 2. The groups will present their report in classroom(or Zoom Classroom) 3. Present your data analysis with a focus on telling the story of the data 4. Make sure you address the problem of your report 5. Communicate actionable insights for the wider business 6. Pitch the above insights to the intended stakeholders 7. Select your group representative to submit your video file/link to the allocated dropbox on VU Collaborate 8. Use the following file naming conventions for your submission:Family name, first name, Assessment 3Business report 9. Your presentation will be viewed during Session 14 so be prepared to respond to any questions from the audience SELF-ENROL INTO A GROUP! You should have formulated groups within your session, so the next thing to do is to self-enrol online via VU Collaborate. Please follow the simple instructions to self-enrol online here opens in new window. ASSESSMENT CRITERIA The following levels of criteria will be used to grade this assessment task: . Business Report 1. Data Wrangling - Rationale and stakeholder question, data exploration 30% 2. Data Visualization - Communication of Insights & Solutions 20% 3. Data Analysis, modelling 30%4. Cohesive group work and equitable distribution of the workload 10% 5. Writing conventions following Business Report format 10% . Presentation 1. Data Storytelling - 40% 2. Effective use of visuals - 20% 3. Clarity of structure and flow, (introduction, conclusion) - 20% 4. Delivery, engagement with audience and time management - 20% https://github.com/rfordatascience/tidytuesday/blob/master/data/2020/2020-11-03/readme.md
Step by Step Solution
There are 3 Steps involved in it
Step: 1
Get Instant Access to Expert-Tailored Solutions
See step-by-step solutions with expert insights and AI powered tools for academic success
Step: 2
Step: 3
Ace Your Homework with AI
Get the answers you need in no time with our AI-driven, step-by-step assistance